HOT TOPICS LIST
- MACD
- Fibonacci
- RSI
- Gann
- ADXR
- Stochastics
- Volume
- Triangles
- Futures
- Cycles
- Volatility
- ZIGZAG
- MESA
- Retracement
- Aroon
INDICATORS LIST
LIST OF TOPICS
PRINT THIS ARTICLE
by Austin Passamonte
Fibonacci retracement, stochastics and chart patterns are used to analyze future moves for Ford Motor Co.
Position: N/A
Austin Passamonte
Austin is a private trader who trades emini stock index futures intraday. He currently trades various futures markets from home in addition to managing a trader's educational forum
PRINT THIS ARTICLE
STOCKS
Ford Remains Tired
08/14/01 12:04:32 PMby Austin Passamonte
Fibonacci retracement, stochastics and chart patterns are used to analyze future moves for Ford Motor Co.
Position: N/A
| Ford Company's woes with the Firestone fiasco may not be the last of this stock's price decline. From a fundamental basis, downgrades this afternoon are predicated upon possible reduction in dividend payments ahead. This is a critical consideration for most value investors who hold these shares long. A weak to questionable economy going forward doesn't offer clear upward guidance in the near-term, either. |
| Taking a look at the stock's internal temperature confirms fundamental guesswork. Signs point to a continuation of Ford's prevailing downtrend ahead: (Weekly & Daily Charts: F) |

|
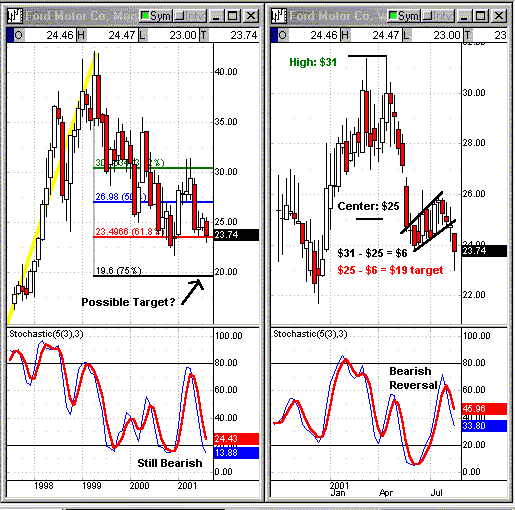
| Figure 1: For Ford, the monthly (left) and weekly (right) charts are hinting at a similar price target, around $19. |
| Graphic provided by: Quote.com. |
| Graphic provided by: QCharts. |
| |
| I like to use two different time frames for the same underlying symbol to see if any congruence exists. In Ford's monthly chart (left) we have a Fibonaci retracement bracket drawn from relative lows near early 1997 to recent highs in 1999. The 62% retracement level at $23.50 has been a price magnet for over a year and continues to be. Should that fail to hold, our next level down is the $19 area. Stochastic values are nearing oversold extreme but have room left for further decline. |
| Does the weekly chart confirm or deny? Well, stochastic values are in the early midst of a bearish reversal as well. We also see a clear bear-flag pattern confirmed by the close below last week and price action continues lower from there. The latest recent high was near $31 and the recent consolidation centers near $25 for a $6 span in price. Commonly we have consolidations form halfway through a move which in this case projects a target $6 lower from the breakdown at $25, which would be the $19 area. |
| Monthly charts suggest $19 may be next and weekly chart technical indicators agree. Two different time frames and three different studies (Fibonacci retracement, stochastic values, and chart patterns) all point to the same evidence: a downhill ride for Ford appears to have smooth sailing ahead! |
Austin is a private trader who trades emini stock index futures intraday. He currently trades various futures markets from home in addition to managing a trader's educational forum
| Title: | Individual Trader |
| Company: | CoiledMarkets.com |
| Address: | PO Box 633 |
| Naples, NY 14512 | |
| Website: | coiledmarkets.com/blog |
| E-mail address: | austinp44@yahoo.com |
Traders' Resource Links | |
| CoiledMarkets.com has not added any product or service information to TRADERS' RESOURCE. | |
Click here for more information about our publications!
Comments
Date: 08/23/01Rank: 5Comment: Excellent content and well written

|

Request Information From Our Sponsors
- StockCharts.com, Inc.
- Candle Patterns
- Candlestick Charting Explained
- Intermarket Technical Analysis
- John Murphy on Chart Analysis
- John Murphy's Chart Pattern Recognition
- John Murphy's Market Message
- MurphyExplainsMarketAnalysis-Intermarket Analysis
- MurphyExplainsMarketAnalysis-Visual Analysis
- StockCharts.com
- Technical Analysis of the Financial Markets
- The Visual Investor
- VectorVest, Inc.
- Executive Premier Workshop
- One-Day Options Course
- OptionsPro
- Retirement Income Workshop
- Sure-Fire Trading Systems (VectorVest, Inc.)
- Trading as a Business Workshop
- VectorVest 7 EOD
- VectorVest 7 RealTime/IntraDay
- VectorVest AutoTester
- VectorVest Educational Services
- VectorVest OnLine
- VectorVest Options Analyzer
- VectorVest ProGraphics v6.0
- VectorVest ProTrader 7
- VectorVest RealTime Derby Tool
- VectorVest Simulator
- VectorVest Variator
- VectorVest Watchdog
