HOT TOPICS LIST
- MACD
- Fibonacci
- RSI
- Gann
- ADXR
- Stochastics
- Volume
- Triangles
- Futures
- Cycles
- Volatility
- ZIGZAG
- MESA
- Retracement
- Aroon
INDICATORS LIST
LIST OF TOPICS
PRINT THIS ARTICLE
by Chaitali Mohile
The US Dollar Index is consolidating after an extensive advance rally.
Position: N/A
Chaitali Mohile
Active trader in the Indian stock markets since 2003 and a full-time writer. Trading is largely based upon technical analysis.
PRINT THIS ARTICLE
CHART ANALYSIS
Is A Breakout For The US Dollar Index In The Cards?
02/12/09 12:29:01 PMby Chaitali Mohile
The US Dollar Index is consolidating after an extensive advance rally.
Position: N/A
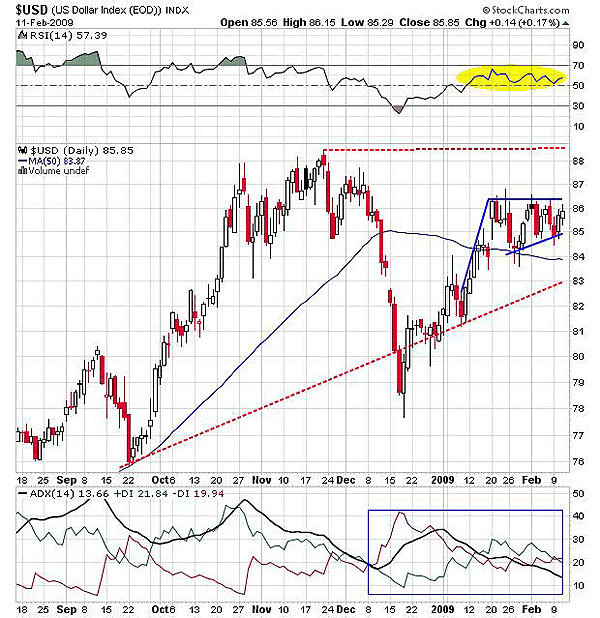
| The US Dollar Index ($USD) has entered a sideways consolidation after a robust bullish rally. Figure 1 shows a bullish flag & pennant continuation pattern that breaks upward. But the stability of the breakout must be questioned in the current economic crisis. The relative strength index (RSI) (14) has established a support at the 50 levels, indicating bullish strength. However, the average directional movement index (ADX) (14) has declined from the comfort zone that indicated a coming downtrend. This means the index is stronger only because the US economy is doing better compared to that of Europe and Japan. In such a scenario, anticipating a successful breakout for the $USD would be incorrect. The previous high resistance at $88.46 may resist the future breakout rally. |

|
| FIGURE 1: $USD, DAILY. The index is consolidating, forming a bullish flag & pennant continuation pattern. |
| Graphic provided by: StockCharts.com. |
| |
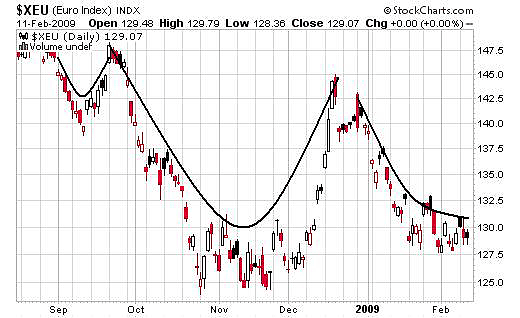
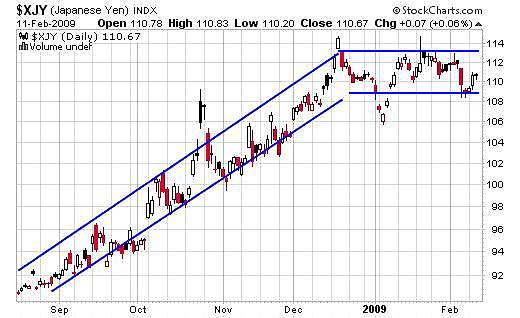
| Below are the daily charts of the Euro Index ($XEU) (Figure 2) and the Japanese Yen Index ($XJY) (Figure 3). $XEU in Figure 2 is highly volatile compared to the yen index. $XJY had a robust bullish rally for a longer period. Currently, $XJY in Figure 3 is consolidating at a higher level. Comparing Figures 1, 2, and 3, $USD and $XJY are better performers than $XEU. But the dollar index seems stronger than the other two. |

|
| FIGURE 2: $XEU, DAILY |
| Graphic provided by: StockCharts.com. |
| |

|
| FIGURE 3: $XJY, DAILY |
| Graphic provided by: StockCharts.com. |
| |
| Due to the weak trend indicated by the ADX (14), the dollar index is likely to remain range-bound in the near future as well. If the flag & pennant pattern breaks upward, then the rally would hit the resistance at $88.46. The trendline from the bottom shows the support at $83. So if the pattern breaks down, $83 would be the strong support. In addition, the 50-day moving average (MA) is the immediate support at $84. |

|
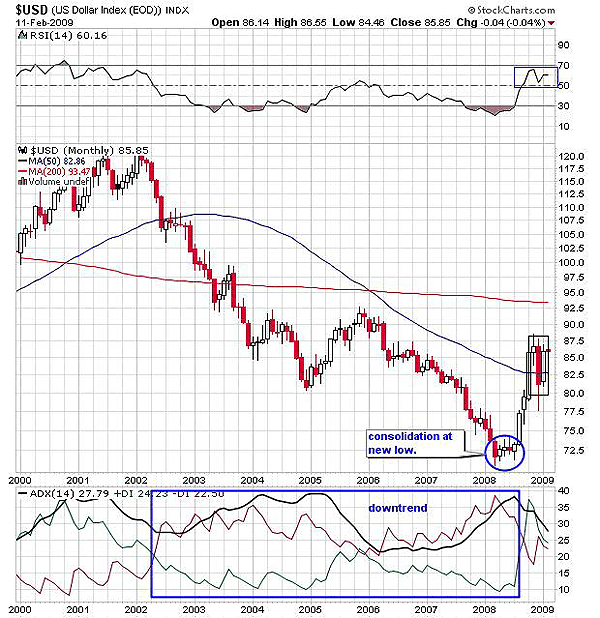
| FIGURE 4: $USD, MONTHLY. The index has moved sideways after a prolonged bullish rally. |
| Graphic provided by: StockCharts.com. |
| |
| Figure 4 would give us a long-term view for $USD. ADX (14) shows a significant downtrend since 2003. The index consolidated at a new low below $72 in 2008 and entered an intermediate uptrend. Therefore, $USD surged from $72.50 and formed a lower high at $87.50 level. Currently, $USD is consolidating near the newly formed support of the 50-day MA. But the intermediate uptrend is declining, so the index may not break out. The RSI (14) in Figure 2 ranged between 50 and 70, indicating bullish strength during consolidation. Thus, $USD is likely to continue to consolidate. |
Active trader in the Indian stock markets since 2003 and a full-time writer. Trading is largely based upon technical analysis.
| Company: | Independent |
| Address: | C1/3 Parth Indraprasth Towers. Vastrapur |
| Ahmedabad, Guj 380015 | |
| E-mail address: | chaitalimohile@yahoo.co.in |
Traders' Resource Links | |
| Independent has not added any product or service information to TRADERS' RESOURCE. | |
Click here for more information about our publications!
Comments
Date: 02/12/09Rank: 4Comment:

Request Information From Our Sponsors
- StockCharts.com, Inc.
- Candle Patterns
- Candlestick Charting Explained
- Intermarket Technical Analysis
- John Murphy on Chart Analysis
- John Murphy's Chart Pattern Recognition
- John Murphy's Market Message
- MurphyExplainsMarketAnalysis-Intermarket Analysis
- MurphyExplainsMarketAnalysis-Visual Analysis
- StockCharts.com
- Technical Analysis of the Financial Markets
- The Visual Investor
- VectorVest, Inc.
- Executive Premier Workshop
- One-Day Options Course
- OptionsPro
- Retirement Income Workshop
- Sure-Fire Trading Systems (VectorVest, Inc.)
- Trading as a Business Workshop
- VectorVest 7 EOD
- VectorVest 7 RealTime/IntraDay
- VectorVest AutoTester
- VectorVest Educational Services
- VectorVest OnLine
- VectorVest Options Analyzer
- VectorVest ProGraphics v6.0
- VectorVest ProTrader 7
- VectorVest RealTime Derby Tool
- VectorVest Simulator
- VectorVest Variator
- VectorVest Watchdog
