HOT TOPICS LIST
- MACD
- Fibonacci
- RSI
- Gann
- ADXR
- Stochastics
- Volume
- Triangles
- Futures
- Cycles
- Volatility
- ZIGZAG
- MESA
- Retracement
- Aroon
INDICATORS LIST
LIST OF TOPICS
PRINT THIS ARTICLE
by Chaitali Mohile
Dollar Tree failed to surge even after forming a new high. The huge gap down breakout was unexpected.
Position: N/A
Chaitali Mohile
Active trader in the Indian stock markets since 2003 and a full-time writer. Trading is largely based upon technical analysis.
PRINT THIS ARTICLE
GAPS
Dollar Tree Had Gap Down Breakout
02/11/09 12:43:28 PMby Chaitali Mohile
Dollar Tree failed to surge even after forming a new high. The huge gap down breakout was unexpected.
Position: N/A
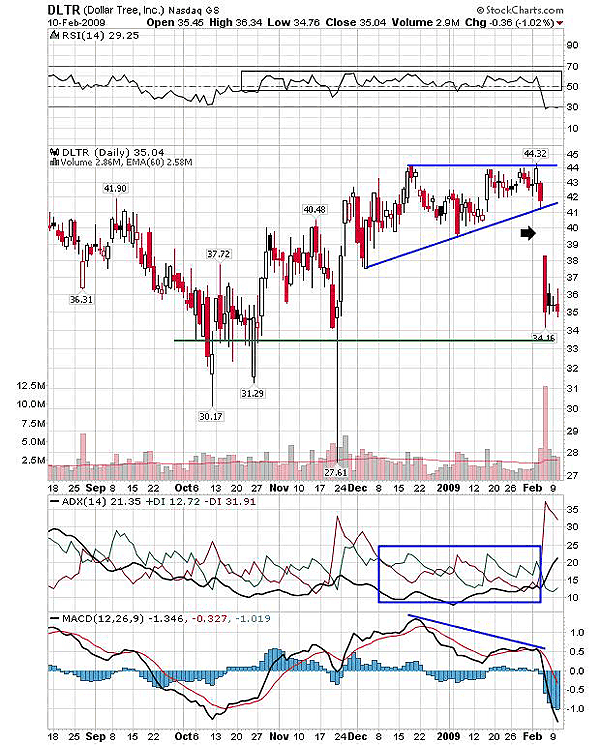
| Dollar Tree (DLTR) was consolidating when it made a 52-week high at $44.32. Since October 2008, the relative strength index (RSI) (14) was ranging in an overbought area between 50 and 70, indicating a bullish strength during consolidation in Figure 1. The average directional index (ADX) (14) was below the 15 level with equal buying and selling pressure (blue rectangle) indicating the consolidation. Both indicators showed mixed signals that resulted in the bullish consolidation. See Figure 1. |
| The ascending triangle was constructed on these mixed notes. The ascending triangle is a bullish continuation pattern that leads the stock higher after the upward breakout. The moving average convergence/divergence (MACD) (12,26,9) differed from the other two indicators. The MACD (12,26,9) formed a lower high though the price surged higher. Therefore, a negative divergence by MACD (12,26,9) was the only bearish indication in Figure 1. |

|
| FIGURE 1: DLTR, DAILY. After the huge gap down breakout, DLTR is consolidating near the previous low. |
| Graphic provided by: StockCharts.com. |
| |
| The negative divergence indicated a downward breakout of the ascending triangle. But the gap down was not at all anticipated. The huge gap down opening was a heartbreaker for the bullish traders. Gaps are highly unpredictable. The announcement for the fourth-quarter results of DLTR was the reason for the huge gap down opening on February 5. The gap down dropped DLTR near the previous low at $33. The stock is now consolidating at the lower levels, but a downtrend is developing. The ADX (14) currently has moved above the 20 levels, indicating a developing downtrend. Therefore, we cannot ignore the downside rally toward the support. |
| The best way to trade the gap is either after the consolidation or after the gap fills. The gap down in Figure 1 can be traded similarly. But for low risk, the stock can also be bought near $33, if the support is established at a previous low. Traders should also follow the indicator's signals while trading from the previously mentioned levels. For example, the RSI (14) should surge above an oversold area, and the MACD (12,26,9) should at least show a bullish crossover at current levels (in negative territory) or recover above the zero line. As the gap is wide, it may take time for the gap to be filled, which means you may lose out on the trading opportunity. |
| You can trade unexpected gaps with correct strategies and due precautions. |
Active trader in the Indian stock markets since 2003 and a full-time writer. Trading is largely based upon technical analysis.
| Company: | Independent |
| Address: | C1/3 Parth Indraprasth Towers. Vastrapur |
| Ahmedabad, Guj 380015 | |
| E-mail address: | chaitalimohile@yahoo.co.in |
Traders' Resource Links | |
| Independent has not added any product or service information to TRADERS' RESOURCE. | |
Click here for more information about our publications!
PRINT THIS ARTICLE

|

Request Information From Our Sponsors
- StockCharts.com, Inc.
- Candle Patterns
- Candlestick Charting Explained
- Intermarket Technical Analysis
- John Murphy on Chart Analysis
- John Murphy's Chart Pattern Recognition
- John Murphy's Market Message
- MurphyExplainsMarketAnalysis-Intermarket Analysis
- MurphyExplainsMarketAnalysis-Visual Analysis
- StockCharts.com
- Technical Analysis of the Financial Markets
- The Visual Investor
- VectorVest, Inc.
- Executive Premier Workshop
- One-Day Options Course
- OptionsPro
- Retirement Income Workshop
- Sure-Fire Trading Systems (VectorVest, Inc.)
- Trading as a Business Workshop
- VectorVest 7 EOD
- VectorVest 7 RealTime/IntraDay
- VectorVest AutoTester
- VectorVest Educational Services
- VectorVest OnLine
- VectorVest Options Analyzer
- VectorVest ProGraphics v6.0
- VectorVest ProTrader 7
- VectorVest RealTime Derby Tool
- VectorVest Simulator
- VectorVest Variator
- VectorVest Watchdog
