HOT TOPICS LIST
- MACD
- Fibonacci
- RSI
- Gann
- ADXR
- Stochastics
- Volume
- Triangles
- Futures
- Cycles
- Volatility
- ZIGZAG
- MESA
- Retracement
- Aroon
INDICATORS LIST
LIST OF TOPICS
PRINT THIS ARTICLE
by Donald W. Pendergast, Jr.
The New York Composite Index still has a number of bearish technicals holding it back, but a few rays of hope are shining through.
Position: N/A
Donald W. Pendergast, Jr.
Donald W. Pendergast is a financial markets consultant who offers specialized services to stock brokers and high net worth individuals who seek a better bottom line for their portfolios.
PRINT THIS ARTICLE
TECHNICAL ANALYSIS
Double Bottom Or Breakdown Ahead for NYA?
02/11/09 12:18:31 PMby Donald W. Pendergast, Jr.
The New York Composite Index still has a number of bearish technicals holding it back, but a few rays of hope are shining through.
Position: N/A
| The New York Composite Index (NYA) lost nearly 56% of its peak value between October 11, 2007, and November 21, 2008, which is no small feat. Not even the bear market of 1973-74 could match the speed of this recent decline (about 50% faster), although it was similar in percentage terms. Is there hope for a strong rebound now, similar to the mighty recovery staged by the broad US markets from late 1974 into mid-1975? |

|
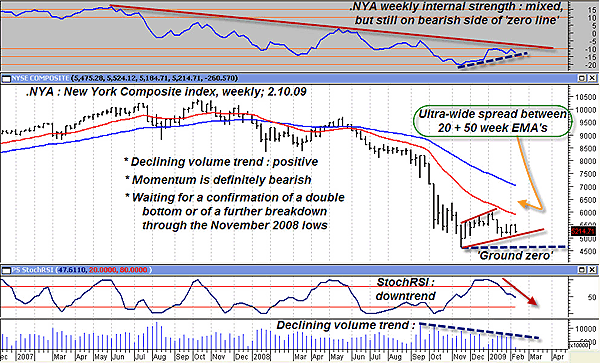
| FIGURE 1: NYA, WEEKLY. Traders everywhere will be watching to see if a double bottom begins to form soon. A breakdown through the November 2008 low would seem to confirm the continuation of this epic bear market. |
| Graphic provided by: MetaStock. |
| |
| The NYA's weekly graph (Figure 1) presents a generally bearish picture, but there are a few glimmers of hope that the recent weakness (since early January 2009) may be more indicative of the formation of a double-bottom pattern than it is of a setup preceding another devastating decline. First off, note the declining volume trend, a pattern that implies that much of the fear is being bled from the market. Next, the internal strength indicator (a blend of the advance-decline line, new highs-new lows, rate of change, and up volume-down volume, although still in bearish territory, is still well above the levels seen during the worst phase of the November 2008 plunge to new lows. Finally, although there is no new high, we do see a higher low in place (see the main price chart). As far as bearish readings go, note how wide the spread is between the 20 and 50-week exponential moving averages (EMAs); it's a lagging indication, of course, but it does emphasize just how weak this market has been. Paradoxically, once the spread gets this wide, it generally will return to a more normal level. The stochRSI indicator's momentum is down, and it will be interesting to see if the red uptrend line will hold this time around. If it does, that could be an early indication that the double-bottom scenario could be taking place. If the uptrend line breaks, the next stop should be near the November low -- or beyond. |

|
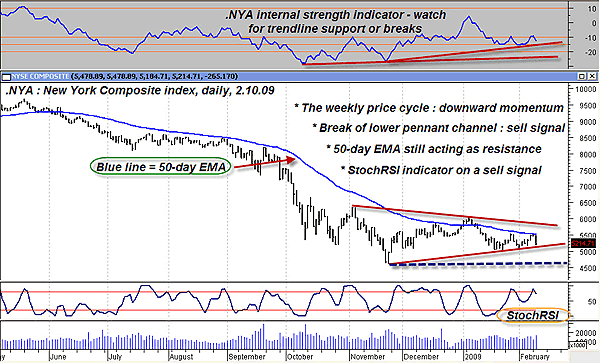
| FIGURE 2: NYA, DAILY. The lower channel line of the pennant is the notable level for the broad US market indexes. The internal strength, though in negative territory, has held up well, possibly hinting that the worst of this bear is behind us. |
| Graphic provided by: MetaStock. |
| |
| Going over to the NYA daily chart (Figure 2), the image presented is also biased toward the bear side of the market. The 50-EMA (blue line) has acted as strong resistance again and price is about to test the lower pennant channel line again. The stochRSI is flashing a fresh sell signal as well. Meanwhile, the internal strength indicator (top pane) is still well shy of its zero line in bearish mode. A breakdown out of the pennant would imply a run south toward the November lows; thousands of traders will be looking with interest at this pattern and a lot of money could be trading hands very soon, depending on the outcome. |
| What's a trader to do when the broad market indexes are in such a configuration? In this case, it might be best to stand aside for a few sessions and see how these daily/weekly patterns in the NYA play out. On a pennant breakdown, the weakest stocks in the weakest industry groups could be shorted (or puts could be purchased). If the double-bottom pattern is confirmed bearing in mind that it will likely take longer to be confirmed than a pennant breakdown, expect a substantial wave of institutional buying across many stock sectors and industry groups. Right now, the two weakest sectors are the financial sector (XLF) and the industrial sector (XLI). The two strongest sectors are the technology sector (XLK) and the health-care sector (XLV). |
Donald W. Pendergast is a financial markets consultant who offers specialized services to stock brokers and high net worth individuals who seek a better bottom line for their portfolios.
| Title: | Writer, market consultant |
| Company: | Linear Trading Systems LLC |
| Jacksonville, FL 32217 | |
| Phone # for sales: | 904-239-9564 |
| E-mail address: | lineartradingsys@gmail.com |
Traders' Resource Links | |
| Linear Trading Systems LLC has not added any product or service information to TRADERS' RESOURCE. | |
Click here for more information about our publications!
Comments
Date: 02/12/09Rank: 3Comment:

Request Information From Our Sponsors
- StockCharts.com, Inc.
- Candle Patterns
- Candlestick Charting Explained
- Intermarket Technical Analysis
- John Murphy on Chart Analysis
- John Murphy's Chart Pattern Recognition
- John Murphy's Market Message
- MurphyExplainsMarketAnalysis-Intermarket Analysis
- MurphyExplainsMarketAnalysis-Visual Analysis
- StockCharts.com
- Technical Analysis of the Financial Markets
- The Visual Investor
- VectorVest, Inc.
- Executive Premier Workshop
- One-Day Options Course
- OptionsPro
- Retirement Income Workshop
- Sure-Fire Trading Systems (VectorVest, Inc.)
- Trading as a Business Workshop
- VectorVest 7 EOD
- VectorVest 7 RealTime/IntraDay
- VectorVest AutoTester
- VectorVest Educational Services
- VectorVest OnLine
- VectorVest Options Analyzer
- VectorVest ProGraphics v6.0
- VectorVest ProTrader 7
- VectorVest RealTime Derby Tool
- VectorVest Simulator
- VectorVest Variator
- VectorVest Watchdog
