HOT TOPICS LIST
- MACD
- Fibonacci
- RSI
- Gann
- ADXR
- Stochastics
- Volume
- Triangles
- Futures
- Cycles
- Volatility
- ZIGZAG
- MESA
- Retracement
- Aroon
INDICATORS LIST
LIST OF TOPICS
PRINT THIS ARTICLE
by Donald W. Pendergast, Jr.
Stocks in the refining industry group have taken a hit since making their major highs in mid-2007. Signs of life remain, however, and Valero Energy Corp. appears to be preparing for a move higher.
Position: Buy
Donald W. Pendergast, Jr.
Donald W. Pendergast is a financial markets consultant who offers specialized services to stock brokers and high net worth individuals who seek a better bottom line for their portfolios.
PRINT THIS ARTICLE
ACCUM./DIST. CHAIKIN
All Systems Are Go For VLO
02/10/09 08:17:27 AMby Donald W. Pendergast, Jr.
Stocks in the refining industry group have taken a hit since making their major highs in mid-2007. Signs of life remain, however, and Valero Energy Corp. appears to be preparing for a move higher.
Position: Buy
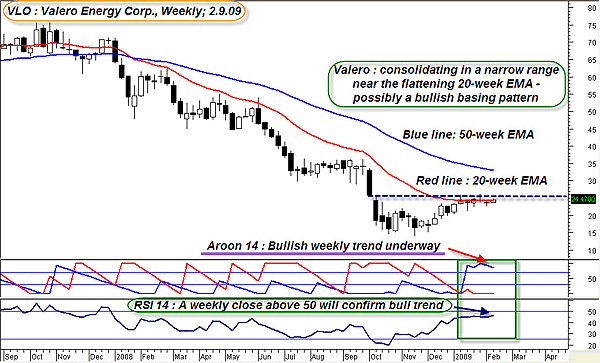
| Valero Energy Corp. (VLO) operates 17 refineries in three different countries, utilizing the expertise of approximately 22,000 employees. The company's stock was on a tear during 2003–07, rising more than 600%. The bull run ended in 2007, with the worst phase of the selloff occurring in 2008. Right now, VLO's charts are suggesting that its bear market may be over, with the possibility of substantial recovery in store. The weekly chart is the first stop (Figure 1). |

|
| FIGURE 1: VLO, WEEKLY. If the weekly RSI (14) can close above 50, the odds are favorable that VLO could move up to challenge resistance areas in the low $30s. |
| Graphic provided by: MetaStock. |
| |
| Lots of positive feedback here;- the Aroon (14) indicator, one of the most accurate, easy-to-understand trend-intensity tools available to today's technician, is clearly in a bullish phase (its blue uptrend line has crossed its red downtrend line and is at a relatively high level); meanwhile, price has consolidated in a narrow range near its 20-week exponential moving average (EMA), and it is a possibility that the stock is forming a base or a platform upon which to prepare an assault to higher levels. Should we see that launch, $31–33 may be one of the first major resistance levels near the 50-week EMA. There is another bullish factor at work, one not necessarily evidenced by the chart - on February 9, 2009, Goldman Sachs (GS) boosted Valero's price target, despite having a longer-term bearish outlook on VLO's industry group. Maybe they know something that we should? |

|
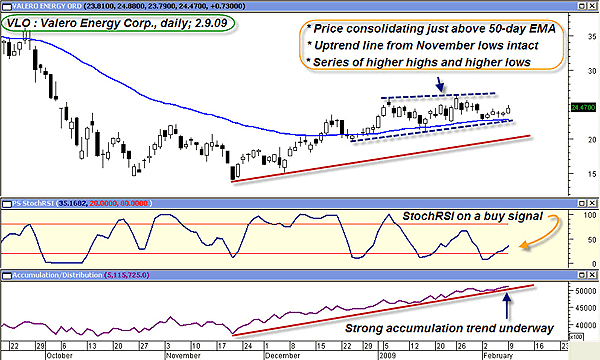
| FIGURE 2: VLO, DAILY. For now, Valero's next target may be the upper (dashed) channel line of the wedge near $26.40. A break below the 50-day EMA and/or lower channel line would likely mean that all bets are off — for now. |
| Graphic provided by: MetaStock. |
| |
| Valero's daily graph gets a little more specific (Figure 2); the 50-day EMA has successfully acted as support four times in a row since late December 2008, a very bullish omen. The consolidation has also begun to form a wedge/pennant pattern, so many traders will be watching. At the same time, the accumulation/distribution indicator has been demonstrating a very strong money flow trend, one that suggests that a bullish breakout may be imminent. The stochRSI is already on a buy signal. Although it might be late to get an ideal entry here, a pullback on a 30-minute chart might allow swing traders to latch on to the next anticipated move up. Of course, the normal bullish evidence is also present, things like the bullish longer-term uptrend line and the series of higher highs and higher lows. The first target is the blue dashed upper channel of the wedge, near $26.40. Should that level be breached on heavy volume, the aforementioned resistance near $31 to $33 (the 50-week EMA line) will probably be the next point of resistance. |
| Longer-term traders might consider buying Valero March 2009 $24 covered calls; March expiration is 38 days away and the $24 calls are going for $2.22 (as of February 9). So for a cash outlay of about $2,250, the return, if called at expiration, would be about $175 or 7.8% in 38 days. The stock also pays a 2.50% annual dividend that those who own shares as of February 11, 2009, will be entitled to receive on March 11, 2009. The dividend is $0.15 per share or $15 for every 100 shares owned. |
| What if the anticipated VLO launch blows up on the pad instead? How to cut losses if you decide you don't want to be a long-term owner of this stock? For covered call holders (who enter as per the scenario described), a break of the daily chart's long-term red uptrend line should be a clear warning to get out of town, even as a confirmed drop of the weekly blue Aroon 14 line below 50 would also warn that an exit is warranted. Swing traders should view (using the daily chart) the lower blue dashed channel line of the wedge and/or the 50-day EMA as the line in the sand; a daily close below either should be reason enough to pull the plug on the trade and to wait for another setup. After all, there's always a trade setup coming along, if you know what to look for. |
Donald W. Pendergast is a financial markets consultant who offers specialized services to stock brokers and high net worth individuals who seek a better bottom line for their portfolios.
| Title: | Writer, market consultant |
| Company: | Linear Trading Systems LLC |
| Jacksonville, FL 32217 | |
| Phone # for sales: | 904-239-9564 |
| E-mail address: | lineartradingsys@gmail.com |
Traders' Resource Links | |
| Linear Trading Systems LLC has not added any product or service information to TRADERS' RESOURCE. | |
Click here for more information about our publications!
Comments
Date: 02/10/09Rank: 2Comment:

Request Information From Our Sponsors
- StockCharts.com, Inc.
- Candle Patterns
- Candlestick Charting Explained
- Intermarket Technical Analysis
- John Murphy on Chart Analysis
- John Murphy's Chart Pattern Recognition
- John Murphy's Market Message
- MurphyExplainsMarketAnalysis-Intermarket Analysis
- MurphyExplainsMarketAnalysis-Visual Analysis
- StockCharts.com
- Technical Analysis of the Financial Markets
- The Visual Investor
- VectorVest, Inc.
- Executive Premier Workshop
- One-Day Options Course
- OptionsPro
- Retirement Income Workshop
- Sure-Fire Trading Systems (VectorVest, Inc.)
- Trading as a Business Workshop
- VectorVest 7 EOD
- VectorVest 7 RealTime/IntraDay
- VectorVest AutoTester
- VectorVest Educational Services
- VectorVest OnLine
- VectorVest Options Analyzer
- VectorVest ProGraphics v6.0
- VectorVest ProTrader 7
- VectorVest RealTime Derby Tool
- VectorVest Simulator
- VectorVest Variator
- VectorVest Watchdog
