HOT TOPICS LIST
- MACD
- Fibonacci
- RSI
- Gann
- ADXR
- Stochastics
- Volume
- Triangles
- Futures
- Cycles
- Volatility
- ZIGZAG
- MESA
- Retracement
- Aroon
INDICATORS LIST
LIST OF TOPICS
PRINT THIS ARTICLE
by Donald W. Pendergast, Jr.
After two months of choppy consolidation, ExxonMobil has a number of bullish technical measurements in agreement.
Position: Buy
Donald W. Pendergast, Jr.
Donald W. Pendergast is a financial markets consultant who offers specialized services to stock brokers and high net worth individuals who seek a better bottom line for their portfolios.
PRINT THIS ARTICLE
MACD
ExxonMobil Ready To Break Higher
02/06/09 08:22:52 AMby Donald W. Pendergast, Jr.
After two months of choppy consolidation, ExxonMobil has a number of bullish technical measurements in agreement.
Position: Buy
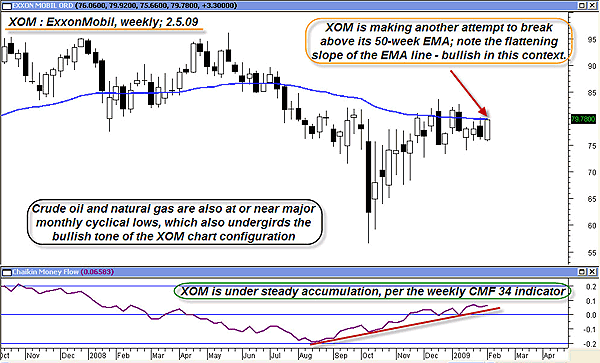
| After months of heavy declines, the crude oil market, along with its related equities, all appear to be an the verge of a new round of bullish breakouts. ExxonMobil (XOM) is the biggest of the big in the energy sector, and it may be telegraphing its intentions to attempt a recovery of its bear market losses of 2008. The weekly chart provides a general overview of XOM's technical posture (Figure 1). |

|
| FIGURE 1: XOM, WEEKLY. A steadily rising money flow trend in combination with a consolidation near a flattening 50-week EMA lends a bullish air. |
| Graphic provided by: MetaStock. |
| |
| Compared to some other energy sector stocks, XOM came through the late 2008 energy bear relatively unscathed. It took a pretty good hit, but the stock rebounded nicely from its October 2008 lows. The stock is still under strong accumulation, as depicted by the weekly Chaikin money flow (34), even as price has consolidated just beneath the 50-week exponential moving average (EMA), one that has begun to flatten out — another bullish aspect to this potential breakout setup. Beyond this general technical backdrop, an even more important event has occurred; crude oil is in the process of establishing a major monthly cyclical low at a seasonally bullish time of the year. Now, let's turn our attention to XOM's daily chart for more specifics (Figure 2). |

|
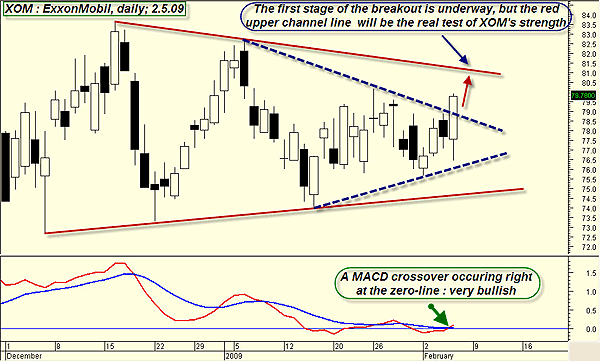
| FIGURE 2: XOM, DAILY. A successful breakout from a pattern within a pattern, one occurring as the MACD completes a bullish zero-line crossover. The red upper channel line may be XOM's next destination. |
| Graphic provided by: MetaStock. |
| |
| XOM has just broken above the minor triangle (framed in blue dashed lines) on a heavy-volume, wide range candle at the same time that it completed a bullish MACD crossover exactly at the point of its zero line. Given the bullish nature of the major cyclical low in crude oil and the strong money flow on the XOM weekly chart, this daily chart setup is (by some estimates, anyway) the equivalent of technical dynamite. Of course, XOM still needs to muster enough strength to break above the upper red channel line of the larger triangle pattern, but until price demonstrates other intentions, it appears that XOM is making a beeline toward that next resistance barrier. |
| Given the nature of the breakout patterns and the incredible zero-line moving average convergence/divergence (MACD) crossover, not to mention the bullish crude oil seasonals and major monthly cycle low, perhaps the wisest way to play this setup is to trade it as a trend-following move. Buying in now (or buying half a position now, and waiting for a modest intraday pullback to add the second half later) and trailing the position with a 2 * 10 average true range (ATR) trailing volatility stop (or a 2.5 * 10 ATR trailing volatility stop) might be the easiest and most stress-free way to let this move in XOM play out. More aggressive intraday players might want to jump in and out more frequently, using 30-minute charts, being sure to stay on the right side of the dominant higher time frame trends. |
| It's been quite a ride for crude since late 2006, and the show may just be getting started, what with long-term rising demand from developing economies and the ever-present danger of Soviet-style "brinkmanship" that uses pipelines and oil/gas reserves instead of ICBMs to exert influence over the global economy. We are living in interesting times, are we not? |
Donald W. Pendergast is a financial markets consultant who offers specialized services to stock brokers and high net worth individuals who seek a better bottom line for their portfolios.
| Title: | Writer, market consultant |
| Company: | Linear Trading Systems LLC |
| Jacksonville, FL 32217 | |
| Phone # for sales: | 904-239-9564 |
| E-mail address: | lineartradingsys@gmail.com |
Traders' Resource Links | |
| Linear Trading Systems LLC has not added any product or service information to TRADERS' RESOURCE. | |
Click here for more information about our publications!
Comments
Date: 02/09/09Rank: 4Comment:

|

Request Information From Our Sponsors
- StockCharts.com, Inc.
- Candle Patterns
- Candlestick Charting Explained
- Intermarket Technical Analysis
- John Murphy on Chart Analysis
- John Murphy's Chart Pattern Recognition
- John Murphy's Market Message
- MurphyExplainsMarketAnalysis-Intermarket Analysis
- MurphyExplainsMarketAnalysis-Visual Analysis
- StockCharts.com
- Technical Analysis of the Financial Markets
- The Visual Investor
- VectorVest, Inc.
- Executive Premier Workshop
- One-Day Options Course
- OptionsPro
- Retirement Income Workshop
- Sure-Fire Trading Systems (VectorVest, Inc.)
- Trading as a Business Workshop
- VectorVest 7 EOD
- VectorVest 7 RealTime/IntraDay
- VectorVest AutoTester
- VectorVest Educational Services
- VectorVest OnLine
- VectorVest Options Analyzer
- VectorVest ProGraphics v6.0
- VectorVest ProTrader 7
- VectorVest RealTime Derby Tool
- VectorVest Simulator
- VectorVest Variator
- VectorVest Watchdog
