HOT TOPICS LIST
- MACD
- Fibonacci
- RSI
- Gann
- ADXR
- Stochastics
- Volume
- Triangles
- Futures
- Cycles
- Volatility
- ZIGZAG
- MESA
- Retracement
- Aroon
INDICATORS LIST
LIST OF TOPICS
PRINT THIS ARTICLE
by Alan R. Northam
Reports are that the economy may be on the road to recovery as homebuilding picks up. Has homebuilding stocks bottomed and a new bull market emerged, or is homebuilding stocks setting themselves up for a fall?
Position: N/A
Alan R. Northam
Alan Northam lives in the Dallas, Texas area and as an electronic engineer gave him an analytical mind from which he has developed a thorough knowledge of stock market technical analysis. His abilities to analyze the future direction of the stock market has allowed him to successfully trade of his own portfolio over the last 30 years. Mr. Northam is now retired and trading the stock market full time. You can reach him at inquiry@tradersclassroom.com or by visiting his website at http://www.tradersclassroom.com. You can also follow him on Twitter @TradersClassrm.
PRINT THIS ARTICLE
TECHNICAL ANALYSIS
Has Homebuilders Put In A Bottom?
02/06/09 08:14:09 AMby Alan R. Northam
Reports are that the economy may be on the road to recovery as homebuilding picks up. Has homebuilding stocks bottomed and a new bull market emerged, or is homebuilding stocks setting themselves up for a fall?
Position: N/A
| According to recent news reports, the economy may be on the mend, pointing to an upturn in housing as a reason. I decided to do my own research to determine if housing has in fact bottomed, and this is what I have found. |
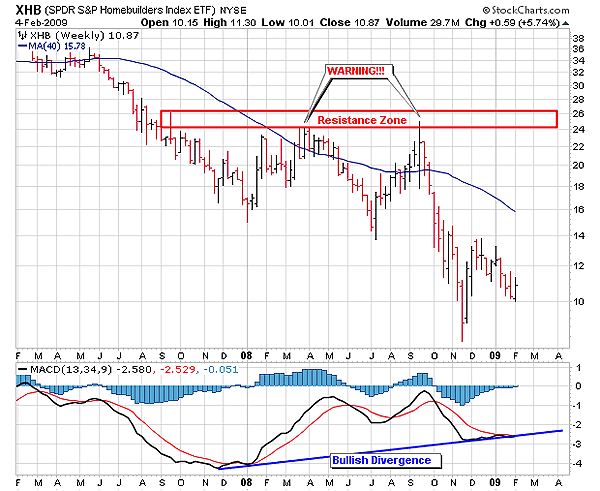
| In Figure 1, I have chosen to use a weekly chart of the SPDR S&P Homebuilders Index (XHB) exchange traded fund (ETF) as our benchmark for the housing sector. This figure shows that over the last two years, the housing sector has been moving lower in a series of waves that have formed lower lows and lower highs. According to Dow theory, this series of waves defines a market that is in a downtrend. Dow theory also states that a series of waves making higher highs and higher lows defines an upward trend. From Figure 1 we can observe that the Homebuilders Index is still in a downtrend. To break this trend, XHB would have to make a higher high than the highs put in place in late March 2008 and mid-September 2008. XHB would then have to form a lower high followed by another higher high. |

|
| FIGURE 1: XHB, WEEKLY. This chart also shows the 40-week simple moving average and the MACD with bullish divergence. |
| Graphic provided by: StockCharts.com. |
| |
| In addition to Dow theory, in defining that the Homebuilders Index remains in a downward trend, I have also shown the 40-week simple moving average. The 40-week simple moving average defines the long-term trend of the market. As long as it is pointing down, the long-term market trend remains down. From Figure 1 we also observe that the 40-week simple moving average is still pointing down and is signaling that the downtrend is still in force. |
| Although Dow theory and the 40-week simple moving average point out that the current trend for the Homebuilders Index remains down, there are two signs in Figure 1 that warn us of a possible upcoming trend reversal. First of all, the high made in September 2008 was higher than the high made in March 2008. The high made in September broke the string of lower highs and is a warning that buying strength is starting to increase. Second, the moving average convergence/divergence (MACD) indicator has formed a bullish divergence. A bullish divergence occurs when price continues to make lower lows while the indicator of price makes higher lows. This bullish divergence signals that the downward momentum of the market is weakening and this usually occurs just before a reversal in trend. |

|
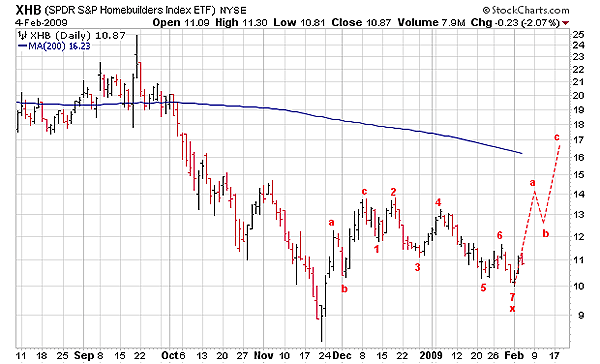
| FIGURE 2: XHB, DAILY. This chart shows the 200-day moving average and the labeling of the Elliott waves during the recent market rally. This chart also shows the price projection in dotted red lines. |
| Graphic provided by: StockCharts.com. |
| |
| When I look at the daily chart (Figure 2) over the last six months, I can see why the news media is reporting that perhaps the economy is on the mend. The Homebuilders Index put in a bottom in late November 2008 and has been working its way higher, but let's look at the evidence in detail. Off the November low, I see three waves, waves a, b, and c. These three waves form an abc zigzag pattern, and according to Elliott wave theory define a market correction. I then see a series of seven overlapping waves. Seven overlapping waves are also corrective, according to Elliott wave theory. These seven waves are known as an X wave that normally connects two corrective wave structures together. It looks like this second corrective wave structure started to develop right at the beginning of February. I have traced out with red dotted lines the most common corrective pattern that could develop, although there are other possibilities. The abc zigzag I traced out moves upward to challenge the 200-day moving average, which I believe is the most logical thing for this market to do. Note that the 200-day moving average is the same as the 40-week moving average in Figure 1. Thus, I expect XHB to move higher in an attempt to challenge the long term trendline. The main point to keep in mind about the rally off the late November 2008 low is that it is a corrective rally as defined by the wave patterns. This then suggests that the challenge of the 200-day moving average, if it occurs, will fail and XHB will ultimately turn back down and make a new lower low price. In conclusion, the signs on the weekly chart warn us that the Homebuilders Index is nearing the end of its downtrend. However, the daily chart shows that the waves produced from last November are corrective in nature. Therefore, we should expect one more downward leg to transpire that will take XHB to new lower low prices. Once XHB makes a new lower low price, then we should also expect a trend reversal to occur at any time. |
Alan Northam lives in the Dallas, Texas area and as an electronic engineer gave him an analytical mind from which he has developed a thorough knowledge of stock market technical analysis. His abilities to analyze the future direction of the stock market has allowed him to successfully trade of his own portfolio over the last 30 years. Mr. Northam is now retired and trading the stock market full time. You can reach him at inquiry@tradersclassroom.com or by visiting his website at http://www.tradersclassroom.com. You can also follow him on Twitter @TradersClassrm.
| Garland, Tx | |
| Website: | www.tradersclassroom.com |
| E-mail address: | inquiry@tradersclassroom.com |
Click here for more information about our publications!
Comments
Date: 02/09/09Rank: 5Comment:

Request Information From Our Sponsors
- StockCharts.com, Inc.
- Candle Patterns
- Candlestick Charting Explained
- Intermarket Technical Analysis
- John Murphy on Chart Analysis
- John Murphy's Chart Pattern Recognition
- John Murphy's Market Message
- MurphyExplainsMarketAnalysis-Intermarket Analysis
- MurphyExplainsMarketAnalysis-Visual Analysis
- StockCharts.com
- Technical Analysis of the Financial Markets
- The Visual Investor
- VectorVest, Inc.
- Executive Premier Workshop
- One-Day Options Course
- OptionsPro
- Retirement Income Workshop
- Sure-Fire Trading Systems (VectorVest, Inc.)
- Trading as a Business Workshop
- VectorVest 7 EOD
- VectorVest 7 RealTime/IntraDay
- VectorVest AutoTester
- VectorVest Educational Services
- VectorVest OnLine
- VectorVest Options Analyzer
- VectorVest ProGraphics v6.0
- VectorVest ProTrader 7
- VectorVest RealTime Derby Tool
- VectorVest Simulator
- VectorVest Variator
- VectorVest Watchdog
