HOT TOPICS LIST
- MACD
- Fibonacci
- RSI
- Gann
- ADXR
- Stochastics
- Volume
- Triangles
- Futures
- Cycles
- Volatility
- ZIGZAG
- MESA
- Retracement
- Aroon
INDICATORS LIST
LIST OF TOPICS
PRINT THIS ARTICLE
by Donald W. Pendergast, Jr.
Financial sector stocks are still weak, and here's a look at one that looks ready to fall further.
Position: Sell
Donald W. Pendergast, Jr.
Donald W. Pendergast is a financial markets consultant who offers specialized services to stock brokers and high net worth individuals who seek a better bottom line for their portfolios.
PRINT THIS ARTICLE
CYCLES
CM Has Short Swing Setup
02/05/09 12:09:21 PMby Donald W. Pendergast, Jr.
Financial sector stocks are still weak, and here's a look at one that looks ready to fall further.
Position: Sell
| The global credit collapses linked to hundreds of trillions of toxic derivative-based securities has exacted a toll on the common stock prices of most money center banks, and Canadian Imperial Bank of Commerce (CM) has been no exception. A gigantic financial institution with more than 39,000 employees worldwide, CIBC's shares are now selling for about a third of what they were going for in late 2007. In fact, the shares may have already put in a major low (during November 2008), but the current state of this stock's technicals suggest that those lows are going to be tested very soon. The fact that CM also has one of the worst relative strength rankings versus the Standard & Poor's 500 only adds to the bearish outlook for this banking heavyweight. |

|
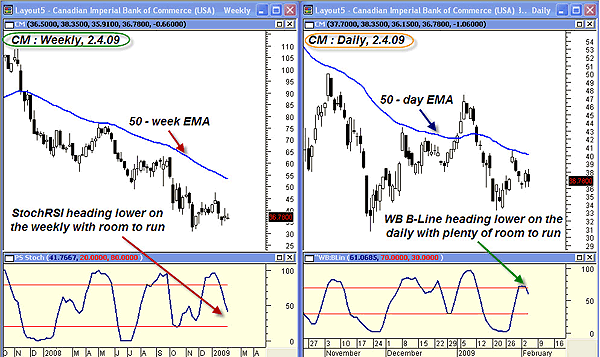
| FIGURE 1: CM, WEEKLY AND DAILY. The weekly and daily charts display a great deal of harmony; both are being driven by strong downward cyclical momentum, with room to run. |
| Graphic provided by: MetaStock. |
| Graphic provided by: WB BLine EOD from ProfitTrader for MetaStock. |
| |
| Figure 1 displays both a weekly (on the left) and a daily (on the right) comparison of the most significant trend and cycle dynamics for CM stock. On the left, the weekly graph shows a very strong downtrend, one well-defined by the downward sloping 50-week exponential moving average (EMA) and the heavy downward direction of the weekly stochRSI indicator. Given the fact that the stochRSI tends to move from signal line to signal line with great regularity, the indicator should be given the benefit of the doubt, in this case that it will continue to move south. On the right side of the chart the same dynamics are evident, only this time in the daily time frame. Here, the WB B-line oscillator has just crossed its signal line and is now pointed downward. Again, this indicator works very well to define regular price cycles in many securities, and the line of least resistance in this stock is, by all measures, down. While traders could simply stop their analysis here and attempt to either short CM shares or buy a put option, if we drill down to an intraday time frame, we may get a better idea of what to expect in the days to come with CM. |

|
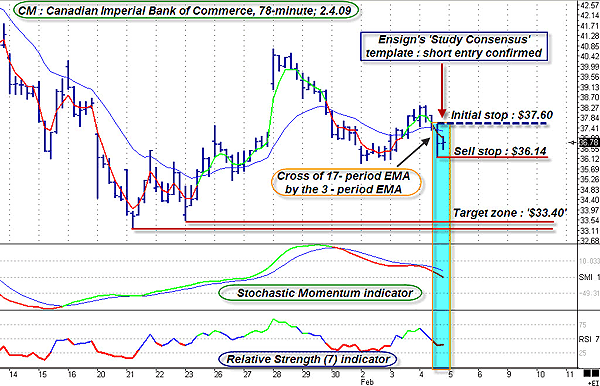
| FIGURE 2: CM, 78-MINUTE. The Study Consensus trio (3/17 EMA cross + stochastic momentum indicator + relative strength (7) indicator) all appear to agree that a short entry here is warranted. Given the downward weekly and daily price cycles in this stock, this 78-minute setup carries more weight. |
| Graphic provided by: Ensign Windows. |
| |
| Here's CM plotted on a 78-minute time frame in Figure 2; it's a good time frame to work with, allowing the trading day to be evenly divided into five bars, unlike the more often used 60-minute bar. And, just as it takes five daily bars to construct one weekly bar, so it also requires five 78-minute bars to construct one daily bar. Depending on your views on trading "numerology," some traders might find it helpful to have their multi-time frame analysis constructed on such a fractal foundation. Interestingly, if you divide 78 by 5, you get 13. What does it all mean? Maybe nothing, except that the fractal relationships all the way from 13 minutes up to one week will all be in harmony, possibly enabling shrewd traders to better interpret the relationships between price cycles and trends as they seek the maximum number of agreements across time frames. Enough of that, let's see what 'ole 78' has to say to us here. Using Ensign's Study Consensus (available as a free download from within Ensign Windows), we find that all three components (the 3/17 EMA crossover, the stochastic momentum indicator and the relative strength index (RSI) (7) indicator) are in agreement that a short entry is warranted. For added safety, more conservative traders may wish to wait for CM to break down through $36.15 rather than shorting on a drop through $36.50 (the most recent 78-minute bar). If filled on a sell-stop, the initial stop-loss could be placed near $37.60. The initial targets reside near the $33.40 area (twin red horizontal lines); given the downward momentum of both the weekly and the daily price cycles, these targets shouldn't have too much problem of being reached, all else being equal. A three-bar trailing stop of the highs may offer a reasonable trailing-stop strategy until prices (hopefully) get close to the target zone. The basic reward-to-risk ratio (RR) of this 78-minute setup is about 1.88 to 1, not bad at all. |
| Will this trade setup even trigger an entry, much less provide a trader with a profitable outcome? No one can say for sure, but the overall scenario of weak relative strength, downward higher time frame momentum, and a consensus agreement among three dissimilar 78-minute indicators would all seem to imply that "down" is the most likely direction for CM shares over the next week or so. |
Donald W. Pendergast is a financial markets consultant who offers specialized services to stock brokers and high net worth individuals who seek a better bottom line for their portfolios.
| Title: | Writer, market consultant |
| Company: | Linear Trading Systems LLC |
| Jacksonville, FL 32217 | |
| Phone # for sales: | 904-239-9564 |
| E-mail address: | lineartradingsys@gmail.com |
Traders' Resource Links | |
| Linear Trading Systems LLC has not added any product or service information to TRADERS' RESOURCE. | |
Click here for more information about our publications!
PRINT THIS ARTICLE

|

Request Information From Our Sponsors
- StockCharts.com, Inc.
- Candle Patterns
- Candlestick Charting Explained
- Intermarket Technical Analysis
- John Murphy on Chart Analysis
- John Murphy's Chart Pattern Recognition
- John Murphy's Market Message
- MurphyExplainsMarketAnalysis-Intermarket Analysis
- MurphyExplainsMarketAnalysis-Visual Analysis
- StockCharts.com
- Technical Analysis of the Financial Markets
- The Visual Investor
- VectorVest, Inc.
- Executive Premier Workshop
- One-Day Options Course
- OptionsPro
- Retirement Income Workshop
- Sure-Fire Trading Systems (VectorVest, Inc.)
- Trading as a Business Workshop
- VectorVest 7 EOD
- VectorVest 7 RealTime/IntraDay
- VectorVest AutoTester
- VectorVest Educational Services
- VectorVest OnLine
- VectorVest Options Analyzer
- VectorVest ProGraphics v6.0
- VectorVest ProTrader 7
- VectorVest RealTime Derby Tool
- VectorVest Simulator
- VectorVest Variator
- VectorVest Watchdog
