HOT TOPICS LIST
- MACD
- Fibonacci
- RSI
- Gann
- ADXR
- Stochastics
- Volume
- Triangles
- Futures
- Cycles
- Volatility
- ZIGZAG
- MESA
- Retracement
- Aroon
INDICATORS LIST
LIST OF TOPICS
PRINT THIS ARTICLE
by Chaitali Mohile
After a huge decline, XLE is consolidating in a converging range. Which pattern is being built?
Position: N/A
Chaitali Mohile
Active trader in the Indian stock markets since 2003 and a full-time writer. Trading is largely based upon technical analysis.
PRINT THIS ARTICLE
TRIANGLES
Energy Select SPDR Forming Triangle?
02/05/09 11:58:06 AMby Chaitali Mohile
After a huge decline, XLE is consolidating in a converging range. Which pattern is being built?
Position: N/A
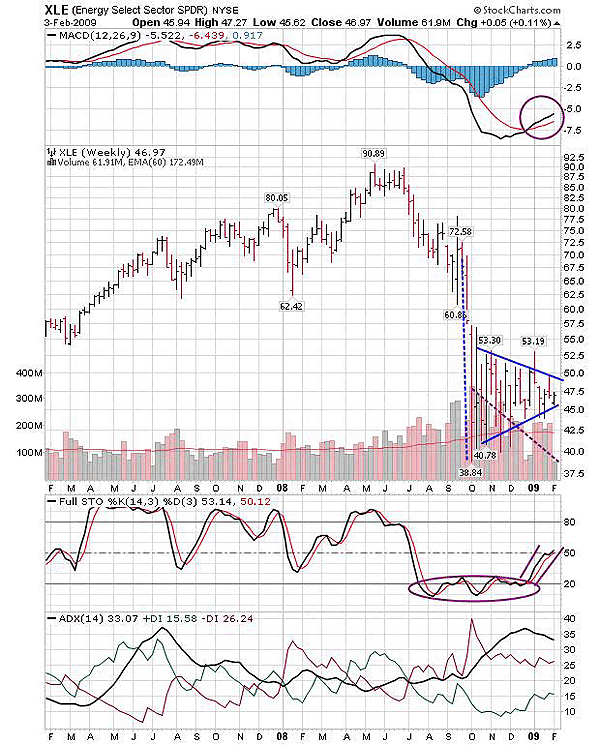
| The Energy Select SPDR (XLE) is consolidating near its low at 38.84. The stock is moving in a narrow range, forming the shape of a symmetrical triangle (cone) in Figure 1. Although XLE entered consolidation after the large descending move, the pattern is not a bearish flag & pennant. The continuation pattern is a short-term formation that can last for one to 12 weeks. The pennant that is more than 12 weeks old can be seen as a symmetrical triangle. The pattern in Figure 1 has been in place since October 2008 (that is, more than 12 weeks). Therefore, the pattern is a symmetrical triangle and not a bearish flag & pennant. The volume in Figure 1 is diminishing due to the converging consolidation range. The duration of patterns is equally important to identify their reliability. |
| The average directional movement index (ADX) (14) indicated the developed downtrend. The moving average convergence/divergence (MACD) (12,26,9) shows a bullish crossover in negative territory. The full stochastic (14,3,3) has surged from an oversold area and has hit the bullish level at 50 (see Figure 1) . Therefore, the indicators are indicating bullish momentum in the developed downtrend. On these mixed messages, we can anticipate a rally from the lower ascending range to an upper descending one. But I would not recommend traders to go long, as the narrow range may whipsaw and catch any market participants unawares. |

|
| FIGURE 1: XLE, DAILY. XLE is forming a symmetrical triangle. Due to the converging range, the volume has decreased. |
| Graphic provided by: StockCharts.com. |
| |
| The breakout direction for the symmetrical triangle is uncertain. Although this triangular formation is a continuation of the current bearish trend, the downward breakout cannot be anticipated. A low-risk and safe-entry point will occur only after the confirmed breakout of a symmetrical triangle. The pattern in Figure 1 has almost matured as both trendlines have moved closer. After the breakout on increased volume, we can measure the potential target by calculating the widest distance of the triangle. If the breakout happens upward, then the trader should add the breakout level to the length of the triangle and subtract the breakout level if the breakout direction is bearish. |
| If the pattern is identified correctly, we can trade successfully. Thus, every aspect of the pattern formation should be understood. |
Active trader in the Indian stock markets since 2003 and a full-time writer. Trading is largely based upon technical analysis.
| Company: | Independent |
| Address: | C1/3 Parth Indraprasth Towers. Vastrapur |
| Ahmedabad, Guj 380015 | |
| E-mail address: | chaitalimohile@yahoo.co.in |
Traders' Resource Links | |
| Independent has not added any product or service information to TRADERS' RESOURCE. | |
Click here for more information about our publications!
Comments
Date: 02/06/09Rank: 2Comment:

Request Information From Our Sponsors
- StockCharts.com, Inc.
- Candle Patterns
- Candlestick Charting Explained
- Intermarket Technical Analysis
- John Murphy on Chart Analysis
- John Murphy's Chart Pattern Recognition
- John Murphy's Market Message
- MurphyExplainsMarketAnalysis-Intermarket Analysis
- MurphyExplainsMarketAnalysis-Visual Analysis
- StockCharts.com
- Technical Analysis of the Financial Markets
- The Visual Investor
- VectorVest, Inc.
- Executive Premier Workshop
- One-Day Options Course
- OptionsPro
- Retirement Income Workshop
- Sure-Fire Trading Systems (VectorVest, Inc.)
- Trading as a Business Workshop
- VectorVest 7 EOD
- VectorVest 7 RealTime/IntraDay
- VectorVest AutoTester
- VectorVest Educational Services
- VectorVest OnLine
- VectorVest Options Analyzer
- VectorVest ProGraphics v6.0
- VectorVest ProTrader 7
- VectorVest RealTime Derby Tool
- VectorVest Simulator
- VectorVest Variator
- VectorVest Watchdog
