HOT TOPICS LIST
- MACD
- Fibonacci
- RSI
- Gann
- ADXR
- Stochastics
- Volume
- Triangles
- Futures
- Cycles
- Volatility
- ZIGZAG
- MESA
- Retracement
- Aroon
INDICATORS LIST
LIST OF TOPICS
PRINT THIS ARTICLE
by Chaitali Mohile
The Gold & Silver Index has been trading in a wide range over the past few months. The index rally has benefited a few gold equities like Gold Fields and Kinross Gold. Do chosen stocks and the index go hand in hand?
Position: N/A
Chaitali Mohile
Active trader in the Indian stock markets since 2003 and a full-time writer. Trading is largely based upon technical analysis.
PRINT THIS ARTICLE
CONSOLID FORMATION
Gold At Resistance
02/04/09 08:42:45 AMby Chaitali Mohile
The Gold & Silver Index has been trading in a wide range over the past few months. The index rally has benefited a few gold equities like Gold Fields and Kinross Gold. Do chosen stocks and the index go hand in hand?
Position: N/A
| The Fibonacci retracement tool in Figure 1 shows that the Philadelphia Gold & Silver index ($XAU) has recovered more than 50% of the correction. The rally that began in October 2008 paused, forming a shooting-star reversal candlestick pattern at $127 in mid-December. Due to the reversal candlestick pattern, the index retraced to the newly formed support at 50% levels. Thereafter, the index has been in a range between $110 and $127. |

|
| FIGURE 1: $XAU, DAILY. The index is undergoing consolidation in a wide range between $110 and $127. |
| Graphic provided by: StockCharts.com. |
| |
| During the consolidation, the lower support of 38.2% retracement level was challenged. Establishing support at $100 (38.2%), $XAU resumed the rally toward the upper range resistance at $127. Over the past few trading sessions, the index has turned volatile near the resistance (see Figure 1). The stochastic (14,3,3) has marginally declined from the highly overbought area of 80. The average directional movement index (ADX) (14) is indicating a weak trend that can lead to the consolidation. Considering both indicators, $XAU is likely to continue its bullish consolidation. The 200-day moving average (MA) is the immediate resistance if the upper range at $127 gets violated. Let us see if the individual equities benefited from the wide range-bound move of the index. |

|
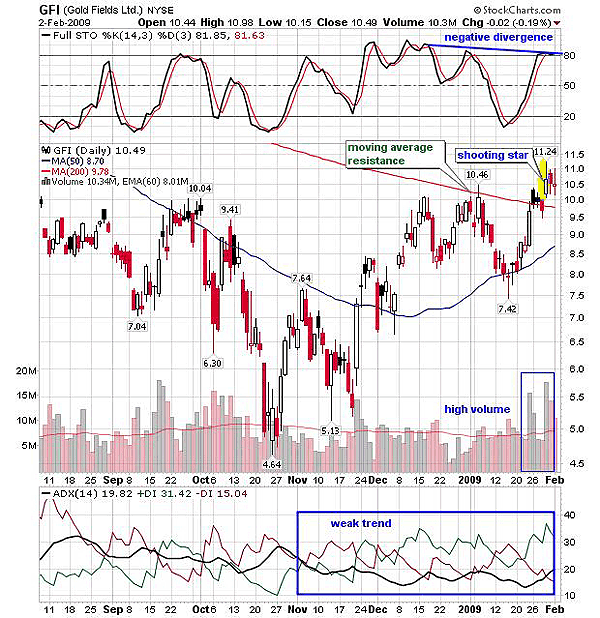
| FIGURE 2: GFI, DAILY. The stock has established support at the 200-day MA. |
| Graphic provided by: StockCharts.com. |
| |
| Gold Fields Ltd. (GFI) surged from the bottom at $4.64 in October. In Figure 2 we can see that the upward rally was filled with large bearish (red) candles, indicating high volatility. Gradually, the stock violated the 200-day moving average (MA) resistance. This indicated that GFI was highly influenced by the price movement of $XAU. GFI and $XAU shows similar price action. GFI has established the support on the 200-day MA but formed the shooting star on January 29, indicating bearish trading sessions in the future. The increased volume was one of the reasons for a successful 200-day MA breakout. |
| The negative divergence on the stochastic (14,3,3) indicated a downside move. But we can also see an oscillator moving flat in an overbought area in Figure 2. Currently, the ADX (14) is indicating the weak trend below 20. Comparing the $XAU movement near the resistance in Figure 1 and the momentum indicators of GFI in Figure 2, the stock is likely to consolidate with the support of the 200-day MA. |

|
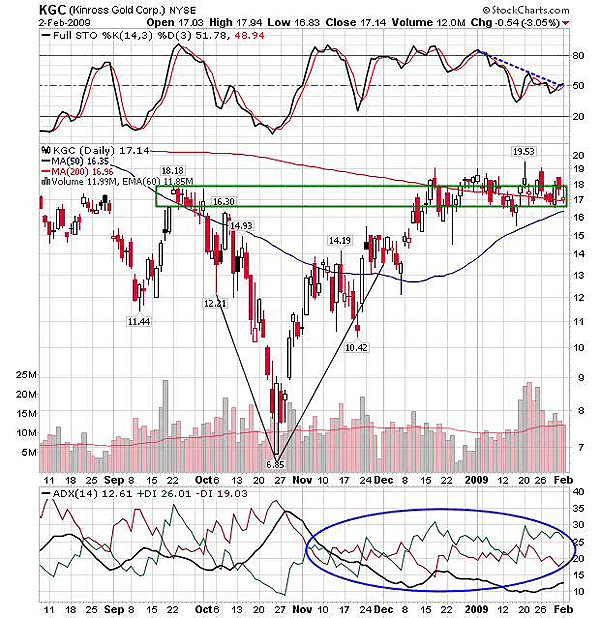
| FIGURE 3: KGC, DAILY. The stock is stuck in the narrow range. |
| Graphic provided by: StockCharts.com. |
| |
| Kinross Gold (KGC) shows a V-shaped recovery in Figure 3. Since early December 2008, KGC has been consolidating at a previous high-resistance area. The range between $19 and $17 is the strong support-resistance area. The 200-day MA is penetrating through the same area. While $XAU was undergoing the range between $110 and $127, KGC moved wildly in the narrow support-resistances area. This indicated the bullish strength in the stock. The volume remained volatile. The trend indicator ADX (14) is below 15, indicating a weak trend. The stochastic (14,3,3) is zigzagging at 50 support levels, indicating high volatility. To maintain the bullish sentiment, KGC must sustain at the support-resistance zone between $19 and $17. The weak trend in KGC and the consolidation range of $XAU will result in tight range-bound sessions for the stock. Therefore, traders may want to stay on the sidelines during the sideways consolidation. Thus, GFI and KGC are following the $XAU road map. The gold index can be traded as the range is wide to carry the trade on either side. But the two stocks are likely to turn volatile during the consolidation. |
Active trader in the Indian stock markets since 2003 and a full-time writer. Trading is largely based upon technical analysis.
| Company: | Independent |
| Address: | C1/3 Parth Indraprasth Towers. Vastrapur |
| Ahmedabad, Guj 380015 | |
| E-mail address: | chaitalimohile@yahoo.co.in |
Traders' Resource Links | |
| Independent has not added any product or service information to TRADERS' RESOURCE. | |
Click here for more information about our publications!
Comments
Date: 02/05/09Rank: 5Comment:
Date: 02/05/09Rank: 5Comment:

Request Information From Our Sponsors
- VectorVest, Inc.
- Executive Premier Workshop
- One-Day Options Course
- OptionsPro
- Retirement Income Workshop
- Sure-Fire Trading Systems (VectorVest, Inc.)
- Trading as a Business Workshop
- VectorVest 7 EOD
- VectorVest 7 RealTime/IntraDay
- VectorVest AutoTester
- VectorVest Educational Services
- VectorVest OnLine
- VectorVest Options Analyzer
- VectorVest ProGraphics v6.0
- VectorVest ProTrader 7
- VectorVest RealTime Derby Tool
- VectorVest Simulator
- VectorVest Variator
- VectorVest Watchdog
- StockCharts.com, Inc.
- Candle Patterns
- Candlestick Charting Explained
- Intermarket Technical Analysis
- John Murphy on Chart Analysis
- John Murphy's Chart Pattern Recognition
- John Murphy's Market Message
- MurphyExplainsMarketAnalysis-Intermarket Analysis
- MurphyExplainsMarketAnalysis-Visual Analysis
- StockCharts.com
- Technical Analysis of the Financial Markets
- The Visual Investor
