HOT TOPICS LIST
- MACD
- Fibonacci
- RSI
- Gann
- ADXR
- Stochastics
- Volume
- Triangles
- Futures
- Cycles
- Volatility
- ZIGZAG
- MESA
- Retracement
- Aroon
INDICATORS LIST
LIST OF TOPICS
PRINT THIS ARTICLE
by Alan R. Northam
The corrective rally off the late November low came to an end in mid-January 2009, and on February 2, 2009, the DJIA officially resumed its downward trend.
Position: N/A
Alan R. Northam
Alan Northam lives in the Dallas, Texas area and as an electronic engineer gave him an analytical mind from which he has developed a thorough knowledge of stock market technical analysis. His abilities to analyze the future direction of the stock market has allowed him to successfully trade of his own portfolio over the last 30 years. Mr. Northam is now retired and trading the stock market full time. You can reach him at inquiry@tradersclassroom.com or by visiting his website at http://www.tradersclassroom.com. You can also follow him on Twitter @TradersClassrm.
PRINT THIS ARTICLE
TECHNICAL ANALYSIS
DJIA Resumes Downward Trend
02/03/09 08:32:57 AMby Alan R. Northam
The corrective rally off the late November low came to an end in mid-January 2009, and on February 2, 2009, the DJIA officially resumed its downward trend.
Position: N/A
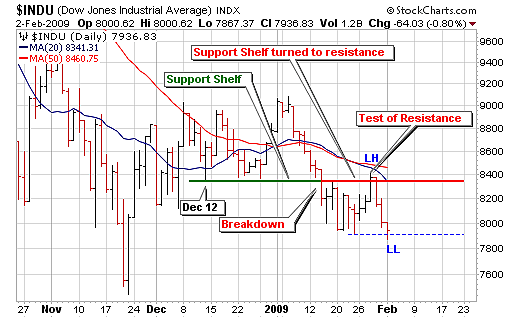
| In late November 2008, the Dow Jones Industrial Average (DJIA) put in a market bottom and then rallied during December (see Figure 1). Looking at the wave structure, note that during the course of December, the DJIA made a series of overlapping waves as it rallied into the new year. Overlapping waves signal a struggle to make upward progress. According to the Elliott wave theory, overlapping waves occur during market corrections. The Elliott wave theory therefore marks the rally from late November to the beginning of the new year as a market correction. |

|
| FIGURE 1: DJIA, DAILY. Here's how the DJIA has appeared over the last four months. |
| Graphic provided by: StockCharts.com. |
| |
| In early January 2009, the DJIA started to sell off and moved below the support shelf drawn off the December 12th low. The breaking of this support shelf signaled the end of the corrective rally that started last November. Market rallies are made up of a series of waves that form higher peaks and higher valleys, and market selloffs by a series of waves that form lower peaks and lower valleys. The breaking of the support shelf in mid-January signaled a breakdown in the series of higher valleys and signals the making of the first lower valley. Six trading days later, after breaking below the support shelf, the DJIA put in its first lower valley. However, the DJIA still needed to make a new lower high to signal the beginning of a new downward trend. The breaking of the support shelf signaled the end of the corrective rally but does not necessarily signal a new downward trend. It could simply mean that the market trend is changing. This change could be in the form of a more shallow upward trend or even a trading range. |
| Three trading days later, after putting in a lower low, the DJIA challenged the support shelf, which has now turned into resistance. The test of resistance held and the DJIA turned back down. The failure of the DJIA to move above this line of resistance ended up forming a lower high. This lower high then signaled that a new downward trend was developing. Three days later, the DJIA made another lower low, confirming that the new downward trend is now in progress. |
| In support of this analysis, note that price is below the 20-day short-term moving average and the 50-day moving average. As long as price continues to remain below these two moving averages, the trend will remain downward. |
Alan Northam lives in the Dallas, Texas area and as an electronic engineer gave him an analytical mind from which he has developed a thorough knowledge of stock market technical analysis. His abilities to analyze the future direction of the stock market has allowed him to successfully trade of his own portfolio over the last 30 years. Mr. Northam is now retired and trading the stock market full time. You can reach him at inquiry@tradersclassroom.com or by visiting his website at http://www.tradersclassroom.com. You can also follow him on Twitter @TradersClassrm.
| Garland, Tx | |
| Website: | www.tradersclassroom.com |
| E-mail address: | inquiry@tradersclassroom.com |
Click here for more information about our publications!
Comments
Date: 02/05/09Rank: 5Comment:

Request Information From Our Sponsors
- StockCharts.com, Inc.
- Candle Patterns
- Candlestick Charting Explained
- Intermarket Technical Analysis
- John Murphy on Chart Analysis
- John Murphy's Chart Pattern Recognition
- John Murphy's Market Message
- MurphyExplainsMarketAnalysis-Intermarket Analysis
- MurphyExplainsMarketAnalysis-Visual Analysis
- StockCharts.com
- Technical Analysis of the Financial Markets
- The Visual Investor
- VectorVest, Inc.
- Executive Premier Workshop
- One-Day Options Course
- OptionsPro
- Retirement Income Workshop
- Sure-Fire Trading Systems (VectorVest, Inc.)
- Trading as a Business Workshop
- VectorVest 7 EOD
- VectorVest 7 RealTime/IntraDay
- VectorVest AutoTester
- VectorVest Educational Services
- VectorVest OnLine
- VectorVest Options Analyzer
- VectorVest ProGraphics v6.0
- VectorVest ProTrader 7
- VectorVest RealTime Derby Tool
- VectorVest Simulator
- VectorVest Variator
- VectorVest Watchdog
