HOT TOPICS LIST
- MACD
- Fibonacci
- RSI
- Gann
- ADXR
- Stochastics
- Volume
- Triangles
- Futures
- Cycles
- Volatility
- ZIGZAG
- MESA
- Retracement
- Aroon
INDICATORS LIST
LIST OF TOPICS
PRINT THIS ARTICLE
by Donald W. Pendergast, Jr.
As the energy sector gradually forms a major low, oil & gas bulls should have little difficulty in locating attractive trade setups.
Position: Accumulate
Donald W. Pendergast, Jr.
Donald W. Pendergast is a financial markets consultant who offers specialized services to stock brokers and high net worth individuals who seek a better bottom line for their portfolios.
PRINT THIS ARTICLE
OPTIONS TRADING
BPZ Hammering Out A Major Low?
02/03/09 08:11:20 AMby Donald W. Pendergast, Jr.
As the energy sector gradually forms a major low, oil & gas bulls should have little difficulty in locating attractive trade setups.
Position: Accumulate
| BPZ Resources, Inc., (BPZ), a Houston, TX–based outfit involved in the exploration and production of oil and natural gas in South America, has seen its stock price cut by about 80% since July 2008, joining many other energy stocks as they plunge along with the entire commodity complex toward major lows. An interesting combination of favorable price cycles, high option volatility, and bullish seasonals for oil and gas may be offering traders a unique way to score some profits in this energy stock. |

|
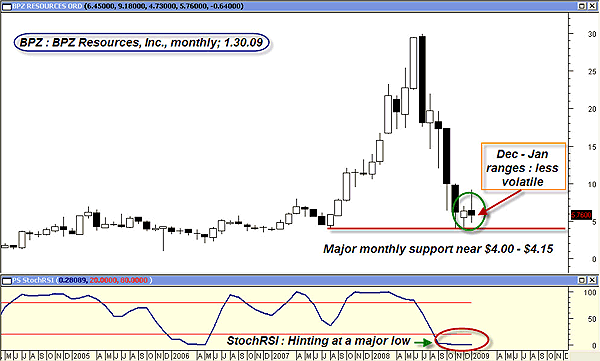
| FIGURE 1: BPZ, MONTHLY. A major monthly low could be forming; the stochRSI is extremely oversold even as prices have rebounded higher off of the major support line near $4.00. |
| Graphic provided by: MetaStock. |
| |
| Given that the entire energy sector (crude oil/natural gas futures and their related equities) appears to be forming a major monthly cycle low, this BPZ monthly graph in Figure 1 also seems to be in agreement. The narrow monthly ranges in both December 2008 and January 2009, the major support line near $4.00, and the oversold monthly stochRSI all seem to imply that for the time being, the line of least resistance in BPZ is toward higher prices. Drilling down to a daily chart will give us a clearer understanding of the current technical dynamics, as can be seen in Figure 2. |

|
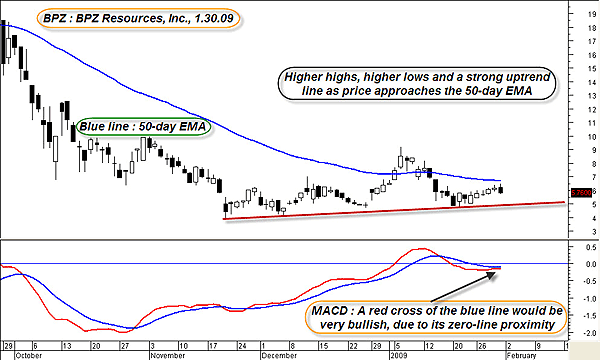
| FIGURE 2: BPZ, DAILY. Higher highs and lows, a strong uptrend line, and a potentially bullish MACD configuration all seem to agree that BPZ may be ready to continue higher. |
| Graphic provided by: MetaStock. |
| |
| All in all, the daily graph of BPZ is signaling that this stock will soon make up its mind. BPZ has traced out a series of higher highs and higher lows, having recently stalled out just shy of its 50-day exponential moving average (EMA). (The 50-period EMA is one of the best trend-delineating moving averages for stock and commodity traders, and you can often find great swing trading opportunities setting up in close proximity to this average.) Most interesting is the position of the moving average convergence/divergence (MACD); both the signal line and the moving average component of the MACD are flattening out, right near the indicator's zero line. A cross of the blue line by the red line would be very bullish, possibly leading to a trend-following opportunity. Since the crossover hasn't occurred yet, here's another bullish way to play BPZ. |
| As of February 2, 2009, a June 2009 $5 BPZ call option can be sold for approximately $1.75. Put another way, a June 2009 $5 covered call can be acquired for about $4.15 ($415). If BPZ shares close at $5 or above at June option expiration (136 days from today), a trader would profit by $85 for each covered call purchased at $415. That's almost a 25% return on the initial cash in just four and a half months. If things don't turn out as planned and BPZ closes below $5 at expiration, the trader keeps his/her BPZ shares and can sell another call against the stock, if desired. Regardless, all of the option premiums will be retained by the trader. |
| Covered calls are especially useful when a stock is at or near a major low (per the trader's definition of a major low), when options implied volatility is relatively high and the fundamentals for the stock are interpreted to be bullish for the next six to 12 months (or more). Given that all of these factors appear to be in harmony on BPZ, this June covered call play seems to fit the definition of a low-risk trading strategy. |
Donald W. Pendergast is a financial markets consultant who offers specialized services to stock brokers and high net worth individuals who seek a better bottom line for their portfolios.
| Title: | Writer, market consultant |
| Company: | Linear Trading Systems LLC |
| Jacksonville, FL 32217 | |
| Phone # for sales: | 904-239-9564 |
| E-mail address: | lineartradingsys@gmail.com |
Traders' Resource Links | |
| Linear Trading Systems LLC has not added any product or service information to TRADERS' RESOURCE. | |
Click here for more information about our publications!
Comments
Date: 02/05/09Rank: 1Comment:

Request Information From Our Sponsors
- StockCharts.com, Inc.
- Candle Patterns
- Candlestick Charting Explained
- Intermarket Technical Analysis
- John Murphy on Chart Analysis
- John Murphy's Chart Pattern Recognition
- John Murphy's Market Message
- MurphyExplainsMarketAnalysis-Intermarket Analysis
- MurphyExplainsMarketAnalysis-Visual Analysis
- StockCharts.com
- Technical Analysis of the Financial Markets
- The Visual Investor
- VectorVest, Inc.
- Executive Premier Workshop
- One-Day Options Course
- OptionsPro
- Retirement Income Workshop
- Sure-Fire Trading Systems (VectorVest, Inc.)
- Trading as a Business Workshop
- VectorVest 7 EOD
- VectorVest 7 RealTime/IntraDay
- VectorVest AutoTester
- VectorVest Educational Services
- VectorVest OnLine
- VectorVest Options Analyzer
- VectorVest ProGraphics v6.0
- VectorVest ProTrader 7
- VectorVest RealTime Derby Tool
- VectorVest Simulator
- VectorVest Variator
- VectorVest Watchdog
