HOT TOPICS LIST
- MACD
- Fibonacci
- RSI
- Gann
- ADXR
- Stochastics
- Volume
- Triangles
- Futures
- Cycles
- Volatility
- ZIGZAG
- MESA
- Retracement
- Aroon
INDICATORS LIST
LIST OF TOPICS
PRINT THIS ARTICLE
by Ron Walker
The horrors that have perpetrated the stock market over the past year have largely cropped up from the financial sector. The financials have no doubt been dicey in recent months, having many challenges before them in these uncertain economic times. But with the injection of capital from the Troubled Assets Relief Program (TARP) funds, the financial sector may be getting just the makeover it needs to establish a bottom, stabilize prices, and instill new confidence into investors.
Position: Buy
Ron Walker
Ron Walker is an active trader and technical analyst. He operates an educational website dedicated to the study of Technical Analysis. The website offers free market analysis with daily video presentations and written commentaries. Ron is a video pioneer, being one of the first to utilize the internet producing Technical Analysis videos. His website is thechartpatterntrader.com
PRINT THIS ARTICLE
GAPS
XLF Fills The Gap
02/02/09 01:40:59 PMby Ron Walker
The horrors that have perpetrated the stock market over the past year have largely cropped up from the financial sector. The financials have no doubt been dicey in recent months, having many challenges before them in these uncertain economic times. But with the injection of capital from the Troubled Assets Relief Program (TARP) funds, the financial sector may be getting just the makeover it needs to establish a bottom, stabilize prices, and instill new confidence into investors.
Position: Buy
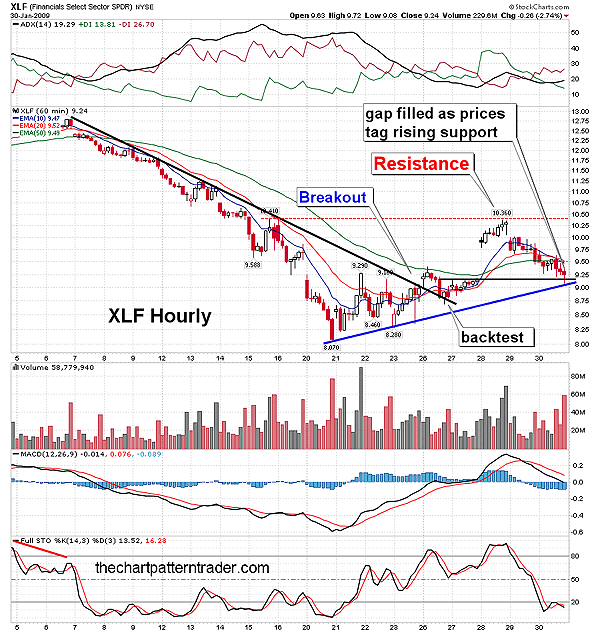
| Recently, I looked at the bullish prospects of the exchange traded fund (ETF) financial select sector SPDR (XLF) in an article for Traders.com Advantage entitled "Banking On A Double Bottom For XLF." At that time, XLF looked poised to move much higher, and it did. The day after I wrote the article on January 26, XLF broke above its decelerated trendline, rising to the 50-period exponential moving average (EMA). From there, it turned lower to successfully backtest that trendline. The breakout and backtest took place the very same day as seen on the hourly chart (see Figure 1). |

|
| FIGURE 1: XLF, HOURLY. After the initial breakout of the decelerated trendline, prices gapped up, slamming the next level of resistance. But a gap lower caused weakness as prices made their way in a downward procession to fill the gap. Once the gap was filled, XLF found support at the rising minor trendline. |
| Graphic provided by: StockCharts.com. |
| |
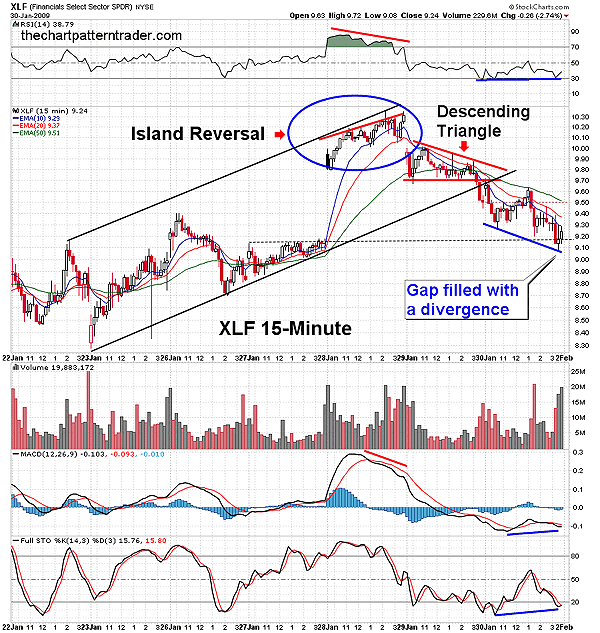
| Just three days after the breakout, on January 28 prices gapped higher at the opening session, breaking above overhead resistance at $9.29. The bulls carried prices to $10.36, where there was strong opposition as the next significant level of resistance came into play. XLF gained more than 14% in just one trading session. Figure 2 shows that a divergence formed on the 15-minute chart between XLF and the relative strength index (14) (RSI). The next day on January 29, prices gapped down, forming an island reversal on the 15-minute chart. After prices gapped lower, they drifted sideways finding support near $9.70 and resistance at the declining 20-period EMA. This caused XLF to put in a series of lower highs that formed a bearish descending triangle on the 15-minute chart. Subsequently, prices broke below the lower boundary of the descending triangle, tramping down below both that horizontal support and the lower boundary of the rising channel. |

|
| FIGURE 2: XLF, 15-MINUTE. As prices gapped up on January 28, a bearish divergence formed with the RSI. The following day, price gapped lower, forming a bearish island reversal. A bearish descending triangle loomed over XLF, ultimately breaking the rising price channel. Once the gap filled a bullish divergence appeared on the RSI, however, the MACD and the stochastic hadn't quite finished completing their divergences. |
| Graphic provided by: StockCharts.com. |
| |
| This may sound like a fly-by-night rally to some, but the rapid price deterioration brought prices back to a sea of support, which may be the catalyst that takes XLF to the next level. XLF is on fertile ground, as prices have now come full circle and filled the gap made on January 28. In addition, a divergence has formed between the RSI (14) and the price chart on the 15-minute chart at these levels. This bullish divergence alerts savvy traders of a potential reversal. Further, shortly after XLF filled the gap, it came to rest on the rising minor trendline on the 60-minute chart (see Figure 1). This cozy alliance of horizontal and rising support may bring about a shift in long-term sentiment, setting the stage to revitalize and reconstruct the advance. But if the minor trendline breaks on the hourly chart, it may handcuff this rally, causing prices to retreat back down for another test of support at $8. Traders who have signed on to the selloff may be caught off-guard if prices bounce off the rising minor trendline. |

|
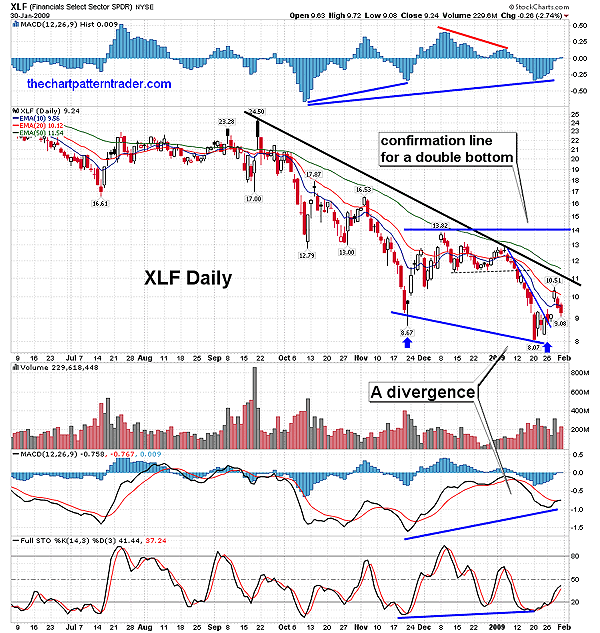
| FIGURE 3: XLF, DAILY. The breakout of the decelerated trendline on the hourly chart has completed a divergence between XLF and the MACD. Momentum is with the bulls, as stochastic is on the rise and the histogram had an upward tick above its zero line. |
| Graphic provided by: StockCharts.com. |
| |
| Filling the gap on the 15-minute chart may just be a precursor that allows prices to break above the intermediate downtrend on the daily chart (Figure 3). XLF will need to build momentum in order to do that, and filling the gap has allowed XLF to establish a solid minor trendline, which could act as a spring board. Prices may bulk up now and attempt to tackle the intermediate trendline. If support at the $9 range holds up, it will bring about optimism that may create demand for XLF. Should XLF muster up the strength it needs to break the intermediate trendline and shake this virus that has stricken the financial sector, it may form a double bottom on its daily chart. In Figure 3, as a result of the breakout that occurred on the decelerated trendline, a hefty divergence has now been completed between XLF and the moving average convergence/divergence (MACD) in the daily time frame. The stochastic is still bullish on the daily chart, allowing the upside momentum to continue. If price breaks above the intermediate downtrend, we could see XLF rise abruptly and precipitously toward that double-bottom confirmation line at $13.82. |
Ron Walker is an active trader and technical analyst. He operates an educational website dedicated to the study of Technical Analysis. The website offers free market analysis with daily video presentations and written commentaries. Ron is a video pioneer, being one of the first to utilize the internet producing Technical Analysis videos. His website is thechartpatterntrader.com
| Website: | thechartpatterntrader.com |
| E-mail address: | thechartpatterntrader@gmail.com |
Click here for more information about our publications!
Comments
Date: 02/03/09Rank: 2Comment:

Request Information From Our Sponsors
- StockCharts.com, Inc.
- Candle Patterns
- Candlestick Charting Explained
- Intermarket Technical Analysis
- John Murphy on Chart Analysis
- John Murphy's Chart Pattern Recognition
- John Murphy's Market Message
- MurphyExplainsMarketAnalysis-Intermarket Analysis
- MurphyExplainsMarketAnalysis-Visual Analysis
- StockCharts.com
- Technical Analysis of the Financial Markets
- The Visual Investor
- VectorVest, Inc.
- Executive Premier Workshop
- One-Day Options Course
- OptionsPro
- Retirement Income Workshop
- Sure-Fire Trading Systems (VectorVest, Inc.)
- Trading as a Business Workshop
- VectorVest 7 EOD
- VectorVest 7 RealTime/IntraDay
- VectorVest AutoTester
- VectorVest Educational Services
- VectorVest OnLine
- VectorVest Options Analyzer
- VectorVest ProGraphics v6.0
- VectorVest ProTrader 7
- VectorVest RealTime Derby Tool
- VectorVest Simulator
- VectorVest Variator
- VectorVest Watchdog
