HOT TOPICS LIST
- MACD
- Fibonacci
- RSI
- Gann
- ADXR
- Stochastics
- Volume
- Triangles
- Futures
- Cycles
- Volatility
- ZIGZAG
- MESA
- Retracement
- Aroon
INDICATORS LIST
LIST OF TOPICS
PRINT THIS ARTICLE
by James Kupfer
After falling in recent weeks, the 20-year Treasury Bond Fund ETF may be nearing a significant support level.
Position: Accumulate
James Kupfer
Mr. Kupfer is a market professional and amateur stock market commentator. Disclosure: It is likely that Mr. Kupfer has or will enter a position in any security he writes about.
PRINT THIS ARTICLE
FIBONACCI
Bonds Near Intermediate Bottom?
01/29/09 02:11:26 PMby James Kupfer
After falling in recent weeks, the 20-year Treasury Bond Fund ETF may be nearing a significant support level.
Position: Accumulate
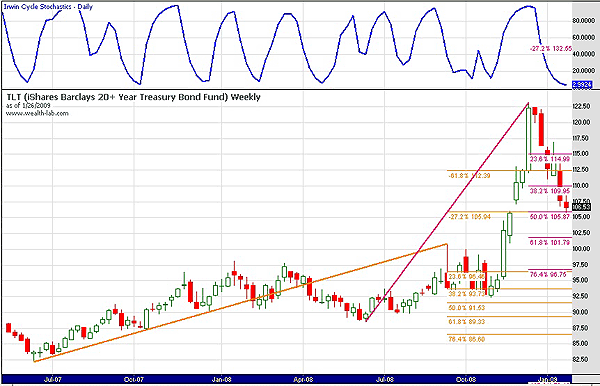
| Looking at a weekly chart of the 20-year Treasury Bond Fund exchange traded fund (ETF), there are a number of indications that point to a potential short- to intermediate-term bottom (Figure 1). |

|
| FIGURE 1: TLT, WEEKLY. TLT has given up much of its recent gains. |
| Graphic provided by: Wealth-Lab. |
| |
| The first of these indications is the convergence of two Fibonacci levels. As shown in orange, 127.7% of the move between the June 2007 low and August 2008 top yields a projection of a $105.94. Similarly, Fibonacci support levels drawn between the June 2008 lows and December 2008 top yield a price target of $105.87 at the 50% retracement level. The difference between those support levels is mere pennies. |
| The second indicator is the weekly stochastics, which are deeply oversold. Finally, TLT has now closed a gap formed in November 2008, when prices moved strongly higher above the 127.7% Fibonacci level previously cited. |
| While there are indications that TLT may be searching for a bottom near the $106 level, this is by no means a certainty. Should TLT break below $106, it would quite possibly have much farther to fall. |
Mr. Kupfer is a market professional and amateur stock market commentator. Disclosure: It is likely that Mr. Kupfer has or will enter a position in any security he writes about.
Click here for more information about our publications!
Comments
Date: 01/30/09Rank: 5Comment:

Request Information From Our Sponsors
- StockCharts.com, Inc.
- Candle Patterns
- Candlestick Charting Explained
- Intermarket Technical Analysis
- John Murphy on Chart Analysis
- John Murphy's Chart Pattern Recognition
- John Murphy's Market Message
- MurphyExplainsMarketAnalysis-Intermarket Analysis
- MurphyExplainsMarketAnalysis-Visual Analysis
- StockCharts.com
- Technical Analysis of the Financial Markets
- The Visual Investor
- VectorVest, Inc.
- Executive Premier Workshop
- One-Day Options Course
- OptionsPro
- Retirement Income Workshop
- Sure-Fire Trading Systems (VectorVest, Inc.)
- Trading as a Business Workshop
- VectorVest 7 EOD
- VectorVest 7 RealTime/IntraDay
- VectorVest AutoTester
- VectorVest Educational Services
- VectorVest OnLine
- VectorVest Options Analyzer
- VectorVest ProGraphics v6.0
- VectorVest ProTrader 7
- VectorVest RealTime Derby Tool
- VectorVest Simulator
- VectorVest Variator
- VectorVest Watchdog
