HOT TOPICS LIST
- MACD
- Fibonacci
- RSI
- Gann
- ADXR
- Stochastics
- Volume
- Triangles
- Futures
- Cycles
- Volatility
- ZIGZAG
- MESA
- Retracement
- Aroon
INDICATORS LIST
LIST OF TOPICS
PRINT THIS ARTICLE
by James Kupfer
The US dollar looks poised to continue its ascent — or does it?
Position: Hold
James Kupfer
Mr. Kupfer is a market professional and amateur stock market commentator. Disclosure: It is likely that Mr. Kupfer has or will enter a position in any security he writes about.
PRINT THIS ARTICLE
TREND-CHANNEL
The Dollar Conundrum
01/29/09 02:07:03 PMby James Kupfer
The US dollar looks poised to continue its ascent — or does it?
Position: Hold
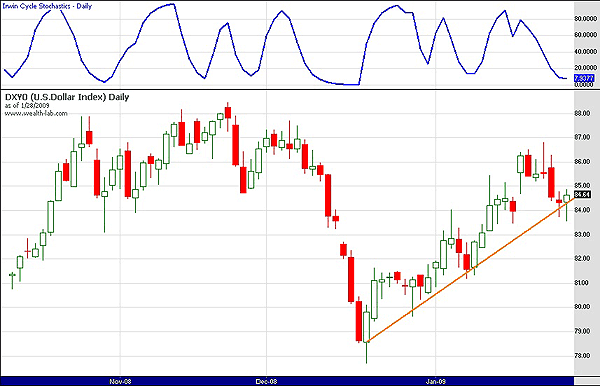
| When you look at a daily chart of the US Dollar Index (Figure 1), there seems to be credible evidence to support the conclusion that the dollar should continue to rise. First, on a closing price basis the dollar has a nice upward-sloping trendline. It has previously tested prices at three locations and can thus be considered to be a valid line. In recent days, prices have deviated too far above the trendline and have since come back to retest the line. With the daily stochastics oversold it would present a logical buying opportunity. |

|
| FIGURE 1: US DOLLAR INDEX, DAILY. The dollar has had a strong runup over the last few weeks. |
| Graphic provided by: Wealth-Lab. |
| |
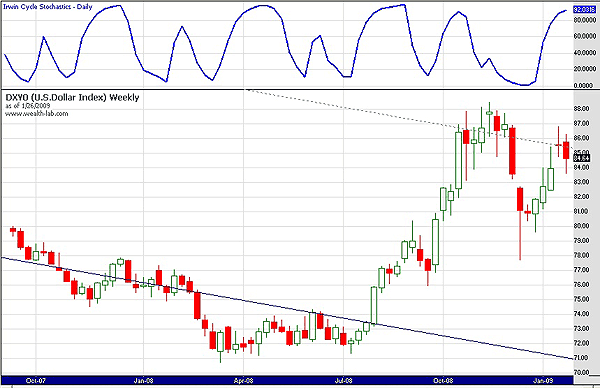
| Switching to the weekly chart (Figure 2), however, presents a very different picture. First, note the dotted blue line cutting through prices after October 2008. That is the top channel of a downward-sloping linear regression channel formed between the January 2002 top and the recent 2008 lows. While prices were able to break slightly above the channel in November 2008, in December they had clearly failed and dropped significantly. Over the last two weeks, prices have again attempted to clear the channel, with no success thus far. |

|
| FIGURE 2: US DOLLAR INDEX, WEEKLY. The upper boundary of the linear regression channel is proving hard to move above. |
| Graphic provided by: Wealth-Lab. |
| |
| These conflicting daily and weekly views point to major indecision in the dollar. At this point, it is probably best to sit back and wait for the dollar to present a clearer picture of where it may go. Traders wishing to go long the dollar based on the daily chart should keep tight stops. However, the better trade might be to see if the dollar breaks below the trendline displayed on the daily chart, in which case the daily and weekly charts would be more in sync with one another. |
Mr. Kupfer is a market professional and amateur stock market commentator. Disclosure: It is likely that Mr. Kupfer has or will enter a position in any security he writes about.
Click here for more information about our publications!
Comments
Date: 01/30/09Rank: 5Comment:

Request Information From Our Sponsors
- StockCharts.com, Inc.
- Candle Patterns
- Candlestick Charting Explained
- Intermarket Technical Analysis
- John Murphy on Chart Analysis
- John Murphy's Chart Pattern Recognition
- John Murphy's Market Message
- MurphyExplainsMarketAnalysis-Intermarket Analysis
- MurphyExplainsMarketAnalysis-Visual Analysis
- StockCharts.com
- Technical Analysis of the Financial Markets
- The Visual Investor
- VectorVest, Inc.
- Executive Premier Workshop
- One-Day Options Course
- OptionsPro
- Retirement Income Workshop
- Sure-Fire Trading Systems (VectorVest, Inc.)
- Trading as a Business Workshop
- VectorVest 7 EOD
- VectorVest 7 RealTime/IntraDay
- VectorVest AutoTester
- VectorVest Educational Services
- VectorVest OnLine
- VectorVest Options Analyzer
- VectorVest ProGraphics v6.0
- VectorVest ProTrader 7
- VectorVest RealTime Derby Tool
- VectorVest Simulator
- VectorVest Variator
- VectorVest Watchdog
