HOT TOPICS LIST
- MACD
- Fibonacci
- RSI
- Gann
- ADXR
- Stochastics
- Volume
- Triangles
- Futures
- Cycles
- Volatility
- ZIGZAG
- MESA
- Retracement
- Aroon
INDICATORS LIST
LIST OF TOPICS
PRINT THIS ARTICLE
by Alan R. Northam
There are many ways to measure if the current low in the market is the bottom. Among these is the major trend direction of the retail market sector.
Position: N/A
Alan R. Northam
Alan Northam lives in the Dallas, Texas area and as an electronic engineer gave him an analytical mind from which he has developed a thorough knowledge of stock market technical analysis. His abilities to analyze the future direction of the stock market has allowed him to successfully trade of his own portfolio over the last 30 years. Mr. Northam is now retired and trading the stock market full time. You can reach him at inquiry@tradersclassroom.com or by visiting his website at http://www.tradersclassroom.com. You can also follow him on Twitter @TradersClassrm.
PRINT THIS ARTICLE
TECHNICAL ANALYSIS
Retail Sector Says Market Bottom Not In Yet
01/29/09 10:32:00 AMby Alan R. Northam
There are many ways to measure if the current low in the market is the bottom. Among these is the major trend direction of the retail market sector.
Position: N/A
| There are many ways to measure the stock market to determine if it is at its bottom. One way to look at the retail market sector. Retail accounts for two-thirds of economic growth, so by looking at what investors think about the future of the economy, all we have to do is look at the retail market sector. If the retail sector starts a new bull market trend, then that will tell us that investors are hopeful about the future of the economy. And if the retail sector remains in a bear market trend, that will also inform us that investors are fearful about the future of the economy. Once the retail market sector starts to recover, then the broader stock market, as measured by the popular indexes, should also start to recover. |
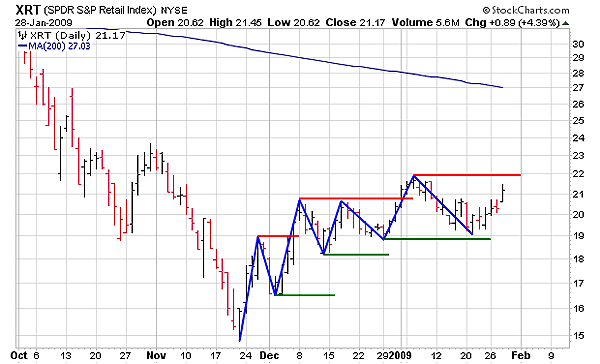
| In Figure 1, I have chosen to use the SPDR S&P Retail Index (XRT) as our benchmark for the retail sector. This figure shows that the retail sector has been moving higher in short-term waves since last November. However, these waves are all overlapping waves. From the Elliott wave theory, overlapping waves are corrective in nature and does not represent the larger trend. Elliott wave theory also states that the larger trend is in a direction opposite from that of the corrective wave pattern. Therefore, we can conclude that since the corrective waves are in an upward direction, the larger trend is still downward. Thus, once the market correction has exhausted itself, the retail sector should continue downward to make a lower low price compared to last November's price low. |

|
| FIGURE 1: XRT, DAILY. This chart shows overlapping waves from the late November price low. According to Elliott wave theory, overlapping waves are corrective. Therefore, the larger trend should continue downward once the market correction has exhausted itself. |
| Graphic provided by: StockCharts.com. |
| |
| To help us determine when the upward correction will end, I have shown a series of resistance and support lines. Resistance lines are drawn in red and support lines in green. In an upward trend, the resistance lines should all be broken but not the support lines. In a downward trend, all the support lines should be broken but not the resistance lines. Looking at the chart, we can see that we need to wait now to find out if the next breakout is above the resistance line or below the support line. This breakout will then tell us if the correction is going to continue upward or if the larger downward trend is resuming. |
| In conclusion, the overlapping waves off the late November low suggests that the upward rally is corrective and not the start of a new bull market trend. Once XRT starts to break its support lines and starts to respect its resistance lines, that will signal that the downward trend has resumed. Therefore, we conclude that the retail market sector has not put in a final bottom, and until it does, we cannot expect a lasting recovery from the broader stock market. |
Alan Northam lives in the Dallas, Texas area and as an electronic engineer gave him an analytical mind from which he has developed a thorough knowledge of stock market technical analysis. His abilities to analyze the future direction of the stock market has allowed him to successfully trade of his own portfolio over the last 30 years. Mr. Northam is now retired and trading the stock market full time. You can reach him at inquiry@tradersclassroom.com or by visiting his website at http://www.tradersclassroom.com. You can also follow him on Twitter @TradersClassrm.
| Garland, Tx | |
| Website: | www.tradersclassroom.com |
| E-mail address: | inquiry@tradersclassroom.com |
Click here for more information about our publications!
Comments
Date: 01/30/09Rank: 5Comment:

Request Information From Our Sponsors
- StockCharts.com, Inc.
- Candle Patterns
- Candlestick Charting Explained
- Intermarket Technical Analysis
- John Murphy on Chart Analysis
- John Murphy's Chart Pattern Recognition
- John Murphy's Market Message
- MurphyExplainsMarketAnalysis-Intermarket Analysis
- MurphyExplainsMarketAnalysis-Visual Analysis
- StockCharts.com
- Technical Analysis of the Financial Markets
- The Visual Investor
- VectorVest, Inc.
- Executive Premier Workshop
- One-Day Options Course
- OptionsPro
- Retirement Income Workshop
- Sure-Fire Trading Systems (VectorVest, Inc.)
- Trading as a Business Workshop
- VectorVest 7 EOD
- VectorVest 7 RealTime/IntraDay
- VectorVest AutoTester
- VectorVest Educational Services
- VectorVest OnLine
- VectorVest Options Analyzer
- VectorVest ProGraphics v6.0
- VectorVest ProTrader 7
- VectorVest RealTime Derby Tool
- VectorVest Simulator
- VectorVest Variator
- VectorVest Watchdog
