HOT TOPICS LIST
- MACD
- Fibonacci
- RSI
- Gann
- ADXR
- Stochastics
- Volume
- Triangles
- Futures
- Cycles
- Volatility
- ZIGZAG
- MESA
- Retracement
- Aroon
INDICATORS LIST
LIST OF TOPICS
PRINT THIS ARTICLE
by Koos van der Merwe
No sun spots have been spotted — which, it seems, suggests that an ice age cometh.
Position: Accumulate
Koos van der Merwe
Has been a technical analyst since 1969, and has worked as a futures and options trader with First Financial Futures in Johannesburg, South Africa.
PRINT THIS ARTICLE
FLAGS AND PENNANTS
Investing In The Coming Mini–Ice Age
01/28/09 08:26:06 AMby Koos van der Merwe
No sun spots have been spotted — which, it seems, suggests that an ice age cometh.
Position: Accumulate
| Earth cooled by about 0.7 degrees Centigrade in 2007. This is the fastest temperature change in the instrumental record and it puts us back to where we were in 1930. If the temperature does not recover sometime soon, we will have to conclude that global warming is over. The number of sunspots follows a cycle of somewhat variable length averaging 11 years. The most recent minimum was in March 2008. The new cycle was supposed to start soon after with a gradual buildup in sunspot activity. The buildup didn't happen. The first sunspot in the cycle appeared in January 2008 but it lasted only two days. The reason this matters is that there is a close correlation between variations in the sunspot cycle and Earth's climate. The previous time a cycle was delayed like this was in the Dalton Minimum, an especially cold period that lasted several decades from 1790 on. Northern European winters became ferocious: In particular, the rout of Napoleon's Grand Army during the retreat from Moscow in 1812 was at least partly due to the lack of sunspots. If the world does face another mini–ice age, it could come without warning. Evidence for abrupt climate change can be readily found in ice cores taken from Greenland and Antarctica. Now this 11-year low in sunspot activity has raised fears among a small but growing number of scientists that rather than getting warmer, Earth could possibly be about to return to another cooling period. The idea is especially intriguing, considering that most of the world is in preparation for global warming. So as a precaution, it could be wise to stock up on heavy coats, just in case. Even better, consider fitting your home with WaterFurnace Renewable Energy. WaterFurnace Renewable Energy, Inc., formerly known as WFI Industries Ltd., provides geothermal and water source heating and cooling systems for residential, commercial, and institutional buildings. WaterFurnace geothermal heating and cooling products are among the most efficient, energy-saving, environmental heat pumps you can purchase. They are a natural heat pump that will give you years of reliable, safe home comfort at a low cost. A WaterFurnace geothermal heat pump system operates more efficiently than ordinary heating and air conditioning systems because it can deliver an astounding five units of energy for every one unit of electrical energy used. By combining stored energy with safe electric power, many WaterFurnace owners realize savings up to 70% for heating, cooling, and hot water. So is it worth stocking up on the shares? |

|
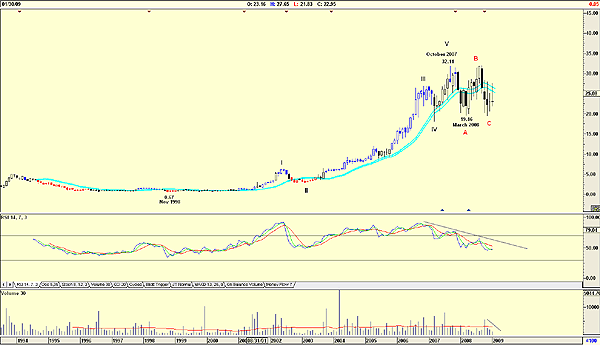
| FIGURE 1: WFI, MONTHLY. The stock price moved from a low of $0.67 in November 1998 to reach a high of $32.11 by November 2007. |
| Graphic provided by: AdvancedGET. |
| |
| Figure 1 is a monthly chart and shows how the stock price moved from a low of $0.67 in November 1998 to reach a high of $32.11 by November 2007. The Elliott wave count suggests that this was a fifth-wave top. The price then fell in an ABC correction, as shown. The relative strength index (RSI) is, however, suggesting that wave C is not complete, but we should note that volume has fallen as the price fell — a sign of strength. |

|
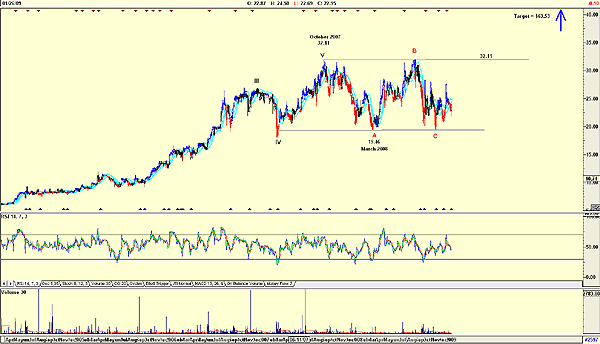
| FIGURE 2: WFI, DAILY. Note here that a flag is developing. |
| Graphic provided by: AdvancedGET. |
| |
| Figure 2, a daily chart, suggests that the ABC correction looks as if it has formed a flag pattern. As we know, an ABC correction should correct somewhere in the fourth wave of lesser degree, and the chart suggests that the price is currently within this range. In addition, note that wave B was as high as wave 5, suggesting that wave C will be a flat. This means that we could see the price rising to test the upper boundary of the flag at $32.11. The RSI is confirming this move upward. Should the price break above $32.11, the upper resistance line, then the target price is $63.53 (32.11 - 0.69 = 31.42 + 32.11 = 63.53). WaterFurnace Renewable Energy has found its place on my watchlist, to be bought only if and when the price breaks above $32.11. Traders with a high-risk profile could buy at present levels with a tight stop, and add to their purchase as the price breaks above the upper resistance line. |
Has been a technical analyst since 1969, and has worked as a futures and options trader with First Financial Futures in Johannesburg, South Africa.
| Address: | 3256 West 24th Ave |
| Vancouver, BC | |
| Phone # for sales: | 6042634214 |
| E-mail address: | petroosp@gmail.com |
Click here for more information about our publications!
Comments
Date: 02/03/09Rank: 5Comment:

Request Information From Our Sponsors
- VectorVest, Inc.
- Executive Premier Workshop
- One-Day Options Course
- OptionsPro
- Retirement Income Workshop
- Sure-Fire Trading Systems (VectorVest, Inc.)
- Trading as a Business Workshop
- VectorVest 7 EOD
- VectorVest 7 RealTime/IntraDay
- VectorVest AutoTester
- VectorVest Educational Services
- VectorVest OnLine
- VectorVest Options Analyzer
- VectorVest ProGraphics v6.0
- VectorVest ProTrader 7
- VectorVest RealTime Derby Tool
- VectorVest Simulator
- VectorVest Variator
- VectorVest Watchdog
- StockCharts.com, Inc.
- Candle Patterns
- Candlestick Charting Explained
- Intermarket Technical Analysis
- John Murphy on Chart Analysis
- John Murphy's Chart Pattern Recognition
- John Murphy's Market Message
- MurphyExplainsMarketAnalysis-Intermarket Analysis
- MurphyExplainsMarketAnalysis-Visual Analysis
- StockCharts.com
- Technical Analysis of the Financial Markets
- The Visual Investor
