HOT TOPICS LIST
- MACD
- Fibonacci
- RSI
- Gann
- ADXR
- Stochastics
- Volume
- Triangles
- Futures
- Cycles
- Volatility
- ZIGZAG
- MESA
- Retracement
- Aroon
INDICATORS LIST
LIST OF TOPICS
PRINT THIS ARTICLE
by Donald W. Pendergast, Jr.
Sunoco currently has one of the highest relative strength ratings versus the S&P 500. Can this energy stock move even higher?
Position: Accumulate
Donald W. Pendergast, Jr.
Donald W. Pendergast is a financial markets consultant who offers specialized services to stock brokers and high net worth individuals who seek a better bottom line for their portfolios.
PRINT THIS ARTICLE
SUPPORT & RESISTANCE
Is Sunoco Poised To Move Higher?
01/29/09 09:14:41 AMby Donald W. Pendergast, Jr.
Sunoco currently has one of the highest relative strength ratings versus the S&P 500. Can this energy stock move even higher?
Position: Accumulate
| Sunoco (SUN) is a major manufacturer and marketer of petroleum and petrochemicals in the eastern third of the US. Right now, its stock has exceptional relative strength versus the broad market indexes and, having recently completed a successful test of major weekly support, it may offer a low-risk trading/investing opportunity. |

|
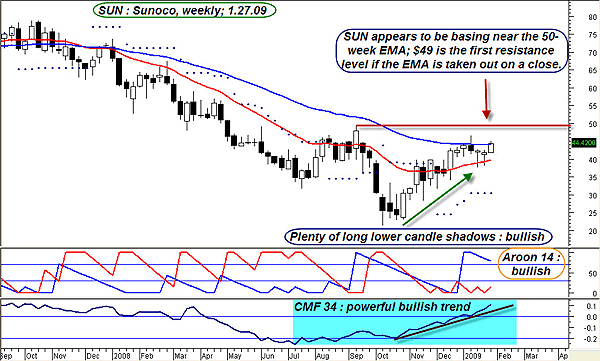
| FIGURE 1: SUN, WEEKLY. A convincing mix of positive money flow, strong trend, and bullish candle patterns seem to imply than this stock may be pausing briefly before continuing higher. |
| Graphic provided by: MetaStock. |
| |
| SUN's weekly graph paints a fairly convincing image of a stock that may be pausing before making another run higher (Figure 1). The Aroon 14 indicator is still in the bullish camp and the Chaikin money flow (CMF) (34) indicator has been in bullish mode since July 2008 (having strengthened significantly since mid-October); check out the numerous long tails on the weekly candles coming up out of the October lows -- more evidence that this stock is under heavy accumulation. Prices have recently paused, forming a small consolidation zone just shy of the 50-week exponential moving average (EMA). Given the rest of the technical clues seen here, it does seem likely that SUN is preparing for another assault on that technically important trend delineator. A weekly close above the 50-week EMA would set the stage for a continuation runup toward resistance at $49 (red horizontal line), the last major swing high. |

|
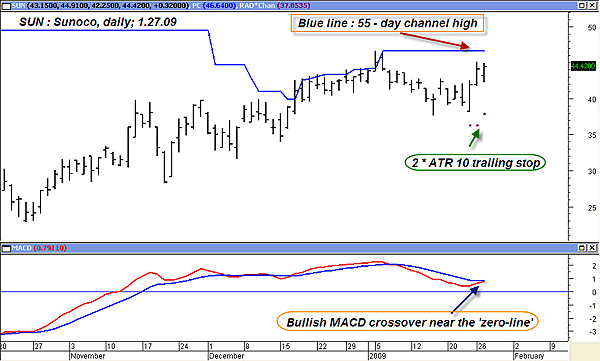
| FIGURE 2: SUN, DAILY. An anticipated bullish MACD crossover, one that occurs near the zero line, is frequently a precursor to a significant trending move, all else being equal. |
| Graphic provided by: MetaStock. |
| |
| Let's look at the daily chart now (Figure 2). The most interesting technical feature is the imminent moving average convergence/divergence (MACD) crossover, particularly bullish due to its proximity to its zero line. In addition, the price is approaching the 55-day upper price channel (of the highs), a breakout entry trigger favored by some trend-followers. Given the technical situation on SUN's weekly chart, this potential for a MACD crossover on the daily chart looks pretty convincing, so instead of playing this move as a swing trade, traders might rather wish to run it as a longer-term trend-following setup, trailing a 2 * ATR 10 volatility stop (purple dots on the chart) as price (hopefully) continues higher. |
| The energy sector may be near a major monthly price cycle low, but that doesn't mean that prices will sail smoothly higher from here. Expect some more volatility as the battle between the energy bulls and bears play out over the next four to eight weeks. For now, SUN appears to be favoring another move higher, so it may be advisable to use modest trade-sizing and a trailing stop. |
Donald W. Pendergast is a financial markets consultant who offers specialized services to stock brokers and high net worth individuals who seek a better bottom line for their portfolios.
| Title: | Writer, market consultant |
| Company: | Linear Trading Systems LLC |
| Jacksonville, FL 32217 | |
| Phone # for sales: | 904-239-9564 |
| E-mail address: | lineartradingsys@gmail.com |
Traders' Resource Links | |
| Linear Trading Systems LLC has not added any product or service information to TRADERS' RESOURCE. | |
Click here for more information about our publications!
Comments
Date: 01/30/09Rank: 4Comment:
Date: 02/01/09Rank: 5Comment:

Request Information From Our Sponsors
- StockCharts.com, Inc.
- Candle Patterns
- Candlestick Charting Explained
- Intermarket Technical Analysis
- John Murphy on Chart Analysis
- John Murphy's Chart Pattern Recognition
- John Murphy's Market Message
- MurphyExplainsMarketAnalysis-Intermarket Analysis
- MurphyExplainsMarketAnalysis-Visual Analysis
- StockCharts.com
- Technical Analysis of the Financial Markets
- The Visual Investor
- VectorVest, Inc.
- Executive Premier Workshop
- One-Day Options Course
- OptionsPro
- Retirement Income Workshop
- Sure-Fire Trading Systems (VectorVest, Inc.)
- Trading as a Business Workshop
- VectorVest 7 EOD
- VectorVest 7 RealTime/IntraDay
- VectorVest AutoTester
- VectorVest Educational Services
- VectorVest OnLine
- VectorVest Options Analyzer
- VectorVest ProGraphics v6.0
- VectorVest ProTrader 7
- VectorVest RealTime Derby Tool
- VectorVest Simulator
- VectorVest Variator
- VectorVest Watchdog
