HOT TOPICS LIST
- MACD
- Fibonacci
- RSI
- Gann
- ADXR
- Stochastics
- Volume
- Triangles
- Futures
- Cycles
- Volatility
- ZIGZAG
- MESA
- Retracement
- Aroon
INDICATORS LIST
LIST OF TOPICS
PRINT THIS ARTICLE
by Chaitali Mohile
Crucell NV has established a strong support after a robust breakout.
Position: N/A
Chaitali Mohile
Active trader in the Indian stock markets since 2003 and a full-time writer. Trading is largely based upon technical analysis.
PRINT THIS ARTICLE
CHART ANALYSIS
Crucell NV Turns Bullish
01/27/09 04:03:05 PMby Chaitali Mohile
Crucell NV has established a strong support after a robust breakout.
Position: N/A
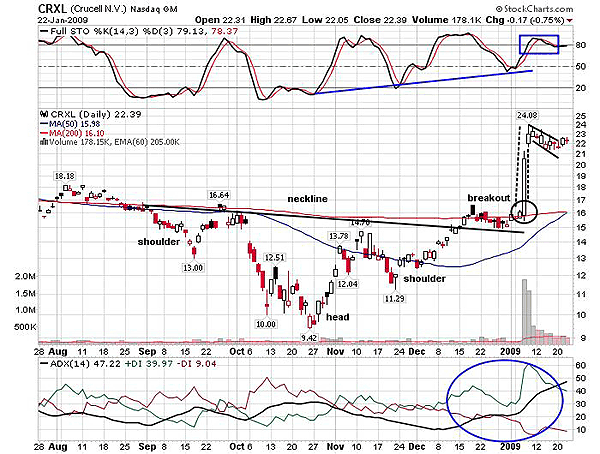
| Crucell NV (CRXL) breached a neckline resistance of an inverse head & shoulders pattern. The 200-day moving average itself was the neckline resistance. The breakout brought the fresh bullish sentiments. After the breakout at $16, CRXL traveled almost $5 in one single day, followed by a gap-up opening. With this, the stock reached the target on inverse head & shoulders (16.64 - 9.42 = 7.22 + 16 (breakout) = 23.22). The full stochastic (14,3,3) formed higher lows at important bullish levels like 20, 50, and currently at 80. The 50-day moving average (MA) is ready to surge above the 200-day MA, indicating a bullish moving average crossover in Figure 1. The crossover suggested a bullish reversal signal and a strong support as well. The average directional movement index (ADX) (14) is indicating a highly overheated uptrend, which may turn down to moderate levels. |

|
| FIGURE 1: CRXL, DAILY. The flag & pennant continuation is being formed after the breakout of an inverted head & shoulders pattern. |
| Graphic provided by: StockCharts.com. |
| |
| The breakout of a head & shoulders pattern has changed the picture for CRXL. The stochastic oscillator is moving flat. The price on the fast track, therefore, consolidated after hitting the target. The consolidation would accumulate the strength for a future rally. In Figure 1, we can see a bullish flag & pennant continuation pattern being formed. Under the bullish scenario, the pattern is likely to break soon. Traders and investors can buy CRXL on a confirmed breakout on high volume. The potential target will be 24 - 16 = 8 + the breakout level = target. I am reluctant to mention the breakout level currently, as the price has not moved decisively above the flag. Though the indicators are suggesting an upside breakout, I would like to wait for the confirmed breakout. |

|
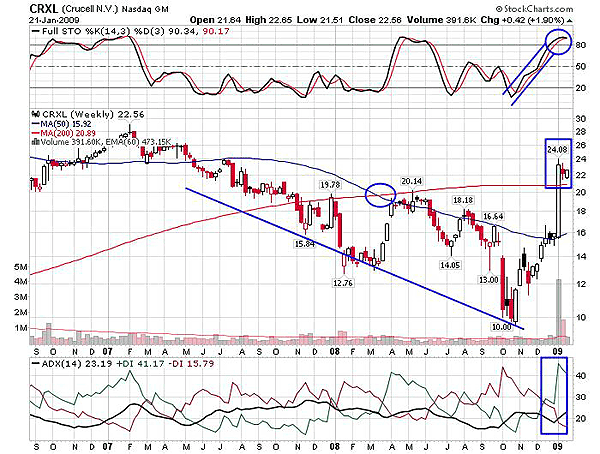
| FIGURE 2: CRXL, WEEKLY. The stock has established support on a 200-day MA. |
| Graphic provided by: StockCharts.com. |
| |
| In Figure 2, we can see that CRXL has been under the 50-day MA resistance since 2007. The stock followed the declining path of the 50-day MA. Finally, the rally that began from $10 converted the major resistance to support and sustained. An oversold stochastic (14,3,3) surged to an overbought territory. This helped price violate another strong resistance of the 200-day MA. Currently, CRXL is consolidating with the support of long-term moving average that is the 200-day MA. The ADX (14) in Figure 2 is indicating developing uptrend, and the stochastic (14,3,3) shows enough room for upside rally. Thus, CRXL is likely to hold the 200-day MA support in Figure 2. But if CRXL fails to sustain at 200-day MA, the next important support will be the 50-day MA. |
| Thus, the overall picture of CRXL has turned bullish after the breakout. |
Active trader in the Indian stock markets since 2003 and a full-time writer. Trading is largely based upon technical analysis.
| Company: | Independent |
| Address: | C1/3 Parth Indraprasth Towers. Vastrapur |
| Ahmedabad, Guj 380015 | |
| E-mail address: | chaitalimohile@yahoo.co.in |
Traders' Resource Links | |
| Independent has not added any product or service information to TRADERS' RESOURCE. | |
Click here for more information about our publications!
PRINT THIS ARTICLE

Request Information From Our Sponsors
- StockCharts.com, Inc.
- Candle Patterns
- Candlestick Charting Explained
- Intermarket Technical Analysis
- John Murphy on Chart Analysis
- John Murphy's Chart Pattern Recognition
- John Murphy's Market Message
- MurphyExplainsMarketAnalysis-Intermarket Analysis
- MurphyExplainsMarketAnalysis-Visual Analysis
- StockCharts.com
- Technical Analysis of the Financial Markets
- The Visual Investor
- VectorVest, Inc.
- Executive Premier Workshop
- One-Day Options Course
- OptionsPro
- Retirement Income Workshop
- Sure-Fire Trading Systems (VectorVest, Inc.)
- Trading as a Business Workshop
- VectorVest 7 EOD
- VectorVest 7 RealTime/IntraDay
- VectorVest AutoTester
- VectorVest Educational Services
- VectorVest OnLine
- VectorVest Options Analyzer
- VectorVest ProGraphics v6.0
- VectorVest ProTrader 7
- VectorVest RealTime Derby Tool
- VectorVest Simulator
- VectorVest Variator
- VectorVest Watchdog
