HOT TOPICS LIST
- MACD
- Fibonacci
- RSI
- Gann
- ADXR
- Stochastics
- Volume
- Triangles
- Futures
- Cycles
- Volatility
- ZIGZAG
- MESA
- Retracement
- Aroon
INDICATORS LIST
LIST OF TOPICS
PRINT THIS ARTICLE
by Donald W. Pendergast, Jr.
The broad markets may look a little shaky right now, but the gold/silver industry group is still chugging higher. Here's a look at one of the better performers in the precious metals complex.
Position: Accumulate
Donald W. Pendergast, Jr.
Donald W. Pendergast is a financial markets consultant who offers specialized services to stock brokers and high net worth individuals who seek a better bottom line for their portfolios.
PRINT THIS ARTICLE
AROON
Iamgold High Relative Strength vs. Broad Market
01/27/09 08:12:33 AMby Donald W. Pendergast, Jr.
The broad markets may look a little shaky right now, but the gold/silver industry group is still chugging higher. Here's a look at one of the better performers in the precious metals complex.
Position: Accumulate
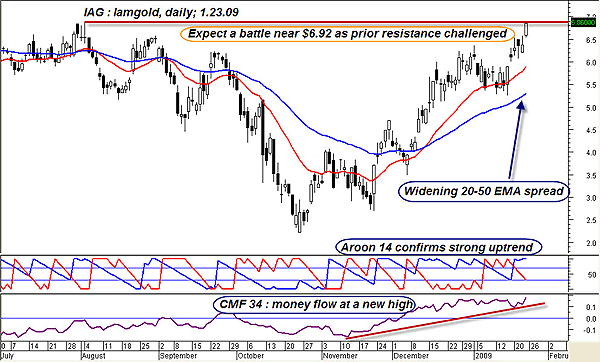
| The mining shares in the gold/silver industry group currently have the best relative strength of any industry group versus the Standard & Poor's 500. Whether that's due to fears of global inflation, the potential for a massive US dollar selloff, or worse, the fact remains that stocks within high relative strength groups tend to offer better opportunities for both daily swing and intraday traders. Here's a brief look at the technicals on Iamgold (IAG), a fairly low-priced stock within the precious metals (PM) group. |

|
| FIGURE 1: IAG, DAILY. Another case of the irresistible force meeting the immovable object? A very strong uptrend in IAG must now overcome a significant prior high at $6.92. |
| Graphic provided by: MetaStock. |
| |
| The power of this stock is undeniable; the Aroon 14 indicator (some technicians find it easier to interpret than the more ubiquitous average directional movement index (ADX)) is confirming the strong uptrend even as the spread between the 20- and 50-day exponential moving averages (EMAs) continues to widen. Adding fuel to the bullish fire, the Chaikin money flow (CMF) (34) is in a very strong uptrend, confirming the steady accumulation of shares at ever-increasing price levels. Really, the only obstacle to further gains now appears to be the resistance barrier formed by the August 2008 high at $6.92. IAG is just a few cents shy of that level now, so a retracement here may offer yet another chance for gold bulls to jump into these shares at a more favorable price. (See Figure 1.) I have a couple of ideas on how both investors and shorter-term traders might play IAG here: |

|
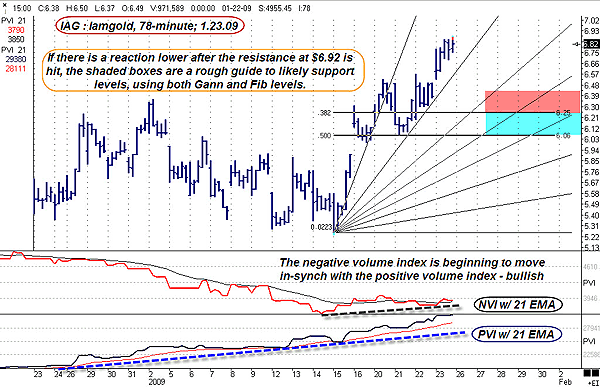
| FIGURE 2: IAG, 78-MINUTE. A combination of Gann fan and Fibonacci retracement levels may offer significant support on an anticipated retracement. Note how the rising positive volume index (PVI) trend would have provided early warning (late December 2008 into mid-January 2009) of the impending break higher. |
| Graphic provided by: Ensign Windows. |
| |
| Dropping down to a 78-minute chart (Figure 2), we can slow the price action down and perhaps get a clue about what's really going on here. Note how price charged higher at a very high angle of attack (as depicted by the Gann fan lines); on the firsr pullback, price found support at the second fan line, which is still acting as a valid trendline. IAG is currently moving higher at a greater than 45 degree angle, and if the $6.92 resistance acts as a major price repellent, it would be logical to assume that price will drop back down toward the third Gann fan line, possibly finding support near the confluence of a fan line and either the Fibonacci 38.2% or 50% retracement level. These areas are highlighted in red and blue and may offer reentry points for intraday traders. If IAG does retrace to those levels, triggering a fresh long signal (the stochRSI indicator generally offers good entry triggers across all time frames, especially when traded in the direction of higher degree trends), the $6.92 area would become the logical trade target zone. |
| For longer-term gold bulls, those convinced of the power of the rising monthly price cycle in gold, silver, and the Gold Bugs Index (.HUI), selling a March $7.50 call against every 100 shares of IAG might not be a bad investment. With a little finagling, shrewd traders should be able to sell those calls for about $0.60 each. If the stock is called at March expiration, the trade would yield about $128 in profit on an initial cash outlay of $622, not bad for a 7-1/2 week investment. Of course, if IAG fails to close above $7.50 by March expiration, the trader keeps the shares and can continue to sell calls against his or her shares, if desired. Generally speaking, selling covered calls only makes sense if you are convinced that a stock is in a sustained bull trend, one that has both fundamental and technical underpinnings worthy of a long entry. |
Donald W. Pendergast is a financial markets consultant who offers specialized services to stock brokers and high net worth individuals who seek a better bottom line for their portfolios.
| Title: | Writer, market consultant |
| Company: | Linear Trading Systems LLC |
| Jacksonville, FL 32217 | |
| Phone # for sales: | 904-239-9564 |
| E-mail address: | lineartradingsys@gmail.com |
Traders' Resource Links | |
| Linear Trading Systems LLC has not added any product or service information to TRADERS' RESOURCE. | |
Click here for more information about our publications!
PRINT THIS ARTICLE

Request Information From Our Sponsors
- StockCharts.com, Inc.
- Candle Patterns
- Candlestick Charting Explained
- Intermarket Technical Analysis
- John Murphy on Chart Analysis
- John Murphy's Chart Pattern Recognition
- John Murphy's Market Message
- MurphyExplainsMarketAnalysis-Intermarket Analysis
- MurphyExplainsMarketAnalysis-Visual Analysis
- StockCharts.com
- Technical Analysis of the Financial Markets
- The Visual Investor
- VectorVest, Inc.
- Executive Premier Workshop
- One-Day Options Course
- OptionsPro
- Retirement Income Workshop
- Sure-Fire Trading Systems (VectorVest, Inc.)
- Trading as a Business Workshop
- VectorVest 7 EOD
- VectorVest 7 RealTime/IntraDay
- VectorVest AutoTester
- VectorVest Educational Services
- VectorVest OnLine
- VectorVest Options Analyzer
- VectorVest ProGraphics v6.0
- VectorVest ProTrader 7
- VectorVest RealTime Derby Tool
- VectorVest Simulator
- VectorVest Variator
- VectorVest Watchdog
