

HOT TOPICS LIST
- MACD
- Fibonacci
- RSI
- Gann
- ADXR
- Stochastics
- Volume
- Triangles
- Futures
- Cycles
- Volatility
- ZIGZAG
- MESA
- Retracement
- Aroon
INDICATORS LIST
LIST OF TOPICS
PRINT THIS ARTICLE
by Donald W. Pendergast, Jr.
Building upon a steadily rising period of accumulation, Halliburton appears ready to move higher after a favorable test of support.
Position: Buy
Donald W. Pendergast, Jr.
Donald W. Pendergast is a financial markets consultant who offers specialized services to stock brokers and high net worth individuals who seek a better bottom line for their portfolios.
PRINT THIS ARTICLE
ACCUM./DIST. CHAIKIN
HAL Breaking Higher After Test Of Support
01/26/09 10:10:54 AMby Donald W. Pendergast, Jr.
Building upon a steadily rising period of accumulation, Halliburton appears ready to move higher after a favorable test of support.
Position: Buy
| Oil service industry group stocks were acting like de facto, cash-generating automated teller machines during the manic runup of crude oil and natural gas prices in 2007–08, but the commodity rout since last July effectively ended the joyride. Since October 2008, however, Halliburton (HAL) has worked off a lot of its bear market volatility, attracting a steady stream of buying over the past three months. The daily chart of HAL will give us an exquisitely simple and convincing image of the current technical state of the stock. |
|
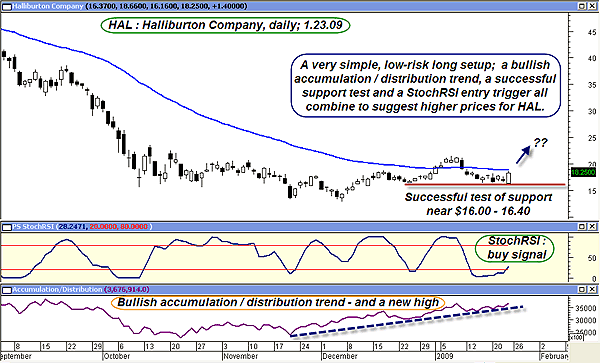
| FIGURE 1: HAL, DAILY. When three (or more) noncorrelated measures of technical price/volume action suggest that a stock is ready to move, a trader can experience greater confidence to actually place the trade. Here, a successful test of support, a bullish reversal bar, a stock RSI long signal and steady increasing money flow (accumulation/distribution) all concur that the line of least resistance is higher. |
| Graphic provided by: MetaStock. |
| Graphic provided by: Ensign Windows. |
| |
| This has got to be one of the simplest and cleanest trade setups ever. Three noncorrelated indicators and/or analysis techniques have combined to offer this low-risk long trade setup in HAL. First, note the long, steady uptrend in the accumulation/distribution indicator (bottom pane); it's bullish in the extreme, hardly even correcting during HAL's recent cycle low. In fact, the indicator just made a new high, even though the price is off from the early January peak. Next, witness the successful support test of the $16.00–16.40 area (red horizontal line), followed by a bullish, wide-range candle. It's just shy of the important 50-period EMA (blue line), which is probably the final barrier standing in HAL's way right now. Finally, check out the stochRSI, a powerful cyclical/momentum tool that frequently catches the start of fresh swings moves, up or down. The indicator has just crossed its signal line, a major long entry confirmation, given the weight of the other technical evidence here. |
| Trade management is relatively straightforward on this setup; the previous support level near $16.10 makes an ideal make-or-break initial stop, and the early January high of $21.47 is the logical initial target for the move. Using these figures, this setup offers a basic risk/reward ratio of about 1.5 to 1, not too bad at all. In fact, given that HAL's monthly price cycle low is already in place, this trade setup should give energy bulls some extra confidence, placing a properly sized (1–2% of account equity) long entry. If the stock reaches the first target quickly, those with nerves of steel might just want to let the entire position run with a trailing stop (perhaps something like a 2 * ATR 10 volatility stop), in an attempt to maximize profits on this stock that has been under such notable accumulation. |
| While no one really knows if HAL will continue higher, Friday's (January 23rd) powerful reversal in the crude oil market lends an extra dose of bullish confirmation to this particular oil services stock trade. |
Donald W. Pendergast is a financial markets consultant who offers specialized services to stock brokers and high net worth individuals who seek a better bottom line for their portfolios.
| Title: | Writer, market consultant |
| Company: | Linear Trading Systems LLC |
| Jacksonville, FL 32217 | |
| Phone # for sales: | 904-239-9564 |
| E-mail address: | lineartradingsys@gmail.com |
Traders' Resource Links | |
| Linear Trading Systems LLC has not added any product or service information to TRADERS' RESOURCE. | |
Click here for more information about our publications!
PRINT THIS ARTICLE

Request Information From Our Sponsors
- VectorVest, Inc.
- Executive Premier Workshop
- One-Day Options Course
- OptionsPro
- Retirement Income Workshop
- Sure-Fire Trading Systems (VectorVest, Inc.)
- Trading as a Business Workshop
- VectorVest 7 EOD
- VectorVest 7 RealTime/IntraDay
- VectorVest AutoTester
- VectorVest Educational Services
- VectorVest OnLine
- VectorVest Options Analyzer
- VectorVest ProGraphics v6.0
- VectorVest ProTrader 7
- VectorVest RealTime Derby Tool
- VectorVest Simulator
- VectorVest Variator
- VectorVest Watchdog
- StockCharts.com, Inc.
- Candle Patterns
- Candlestick Charting Explained
- Intermarket Technical Analysis
- John Murphy on Chart Analysis
- John Murphy's Chart Pattern Recognition
- John Murphy's Market Message
- MurphyExplainsMarketAnalysis-Intermarket Analysis
- MurphyExplainsMarketAnalysis-Visual Analysis
- StockCharts.com
- Technical Analysis of the Financial Markets
- The Visual Investor