HOT TOPICS LIST
- MACD
- Fibonacci
- RSI
- Gann
- ADXR
- Stochastics
- Volume
- Triangles
- Futures
- Cycles
- Volatility
- ZIGZAG
- MESA
- Retracement
- Aroon
INDICATORS LIST
LIST OF TOPICS
PRINT THIS ARTICLE
by Donald W. Pendergast, Jr.
After staging a powerful rally from its bear market lows, shares of Ford Motor Co. (F) have been correcting on declining volume. A distinctly bullish price pattern is now evident on the chart, one worth a second look.
Position: N/A
Donald W. Pendergast, Jr.
Donald W. Pendergast is a financial markets consultant who offers specialized services to stock brokers and high net worth individuals who seek a better bottom line for their portfolios.
PRINT THIS ARTICLE
RECURRENT PATTERNS
Gartley 222 Pattern Taking Shape For Ford
01/26/09 09:54:11 AMby Donald W. Pendergast, Jr.
After staging a powerful rally from its bear market lows, shares of Ford Motor Co. (F) have been correcting on declining volume. A distinctly bullish price pattern is now evident on the chart, one worth a second look.
Position: N/A
| It's been a very tough economic climate for the US automakers, but apparently Ford Motor Co. (F) is in better overall financial condition than its domestic competitors. After making a major low in late November 2008, prices shot higher, rising more than 200% in three weeks, albeit from a very low price level. What's on the chart now, and what's it telling us traders? |

|
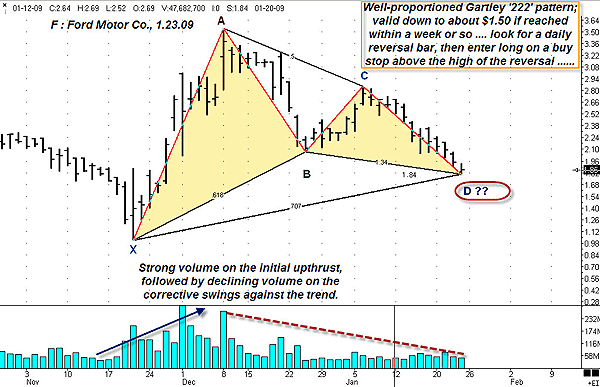
| FIGURE 1: FORD. Price can drop as low as $1.50 without invalidating the bullish Gartley 222 pattern, as long as the ratio of XD to AD doesn't exceed 0.786, that is. |
| Graphic provided by: Ensign Windows. |
| |
| In Figure 1, we can see that a fairly well-structured Gartley 222 pattern (aka the butterfly pattern) is close to completion on Ford's daily chart. All of the proper Fibonacci ratios are evident, although I would have preferred to see a 0.618 figure for the AB to BC ratio. Other than that, all that this pattern really needs now is a strong daily bullish reversal bar, one with strong volume propelling it higher. If that happens, and prices haven't dropped below $1.50 at the time of such a reversal bar, then the next step is for traders to place a buy-stop order just above the high of the reversal bar, being sure to keep the risk to their accounts at a modest level. If the buy stop is filled, a stop-loss can be placed a few ticks below the low of the reversal bar. The initial target for these 222 patterns is usually projected to be 0.618 of the length of swing CD. If the trade were entered at, say, $1.80, the first price target would be projected at approximately $2.60, which is the 61.8% retracement of swing CD. There are a couple of other technical clues that suggest that F can make a move higher now. For starters, look at the very bullish volume pattern (bottom pane of chart) on the launch higher from the major low; volume increased dramatically during the rise, even as it gradually declined on the subsequent corrective swings. Ford shares are also in the general area of a monthly cyclical low, another potentially bullish factor. |
| Even though Ford may be preparing for a move back up, it's still vital that traders confirm that the broad markets are also in a generally bullish posture before considering an entry into any long position. In addition, given that Ford is a component of an industry group that's in the grip of a major economic downdraft, traders may also wish to deploy a more modest trade sizing strategy than they might otherwise use. |
Donald W. Pendergast is a financial markets consultant who offers specialized services to stock brokers and high net worth individuals who seek a better bottom line for their portfolios.
| Title: | Writer, market consultant |
| Company: | Linear Trading Systems LLC |
| Jacksonville, FL 32217 | |
| Phone # for sales: | 904-239-9564 |
| E-mail address: | lineartradingsys@gmail.com |
Traders' Resource Links | |
| Linear Trading Systems LLC has not added any product or service information to TRADERS' RESOURCE. | |
Click here for more information about our publications!
Comments

Request Information From Our Sponsors
- StockCharts.com, Inc.
- Candle Patterns
- Candlestick Charting Explained
- Intermarket Technical Analysis
- John Murphy on Chart Analysis
- John Murphy's Chart Pattern Recognition
- John Murphy's Market Message
- MurphyExplainsMarketAnalysis-Intermarket Analysis
- MurphyExplainsMarketAnalysis-Visual Analysis
- StockCharts.com
- Technical Analysis of the Financial Markets
- The Visual Investor
- VectorVest, Inc.
- Executive Premier Workshop
- One-Day Options Course
- OptionsPro
- Retirement Income Workshop
- Sure-Fire Trading Systems (VectorVest, Inc.)
- Trading as a Business Workshop
- VectorVest 7 EOD
- VectorVest 7 RealTime/IntraDay
- VectorVest AutoTester
- VectorVest Educational Services
- VectorVest OnLine
- VectorVest Options Analyzer
- VectorVest ProGraphics v6.0
- VectorVest ProTrader 7
- VectorVest RealTime Derby Tool
- VectorVest Simulator
- VectorVest Variator
- VectorVest Watchdog
