HOT TOPICS LIST
- MACD
- Fibonacci
- RSI
- Gann
- ADXR
- Stochastics
- Volume
- Triangles
- Futures
- Cycles
- Volatility
- ZIGZAG
- MESA
- Retracement
- Aroon
INDICATORS LIST
LIST OF TOPICS
PRINT THIS ARTICLE
by Chaitali Mohile
After a deep downtrend, Sears Holding is consolidating, forming higher lows. Will the consolidation form a trend reversal pattern?
Position: N/A
Chaitali Mohile
Active trader in the Indian stock markets since 2003 and a full-time writer. Trading is largely based upon technical analysis.
PRINT THIS ARTICLE
ASCENDING TRIANGLES
Sears Holding Moves In Narrow Range
01/23/09 09:53:53 AMby Chaitali Mohile
After a deep downtrend, Sears Holding is consolidating, forming higher lows. Will the consolidation form a trend reversal pattern?
Position: N/A
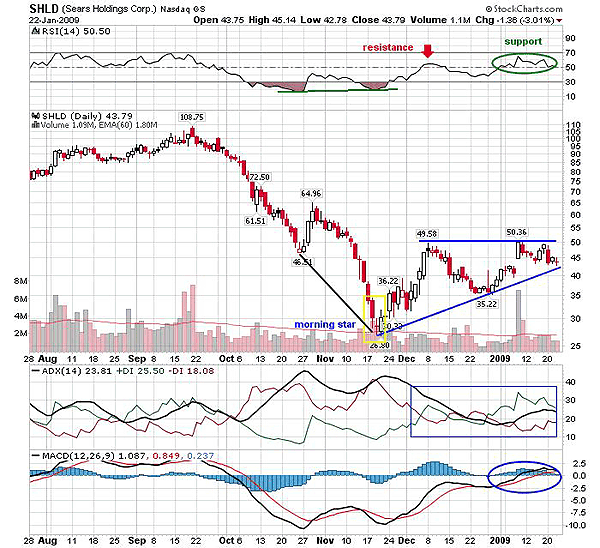
| In a short period of correction, the share value of Sears Holding Corp (SHLD) slipped in double digits. Taking an advantage of a declining overheated downtrend as indicated by the average directional movement index (ADX) (14), SHLD tried to recover at $46.51. However, the decline in the highly developed ADX (14) created room for the robust downtrend. As a result, the stock took a nosedive down to $26.80. But the relative strength index (RSI) (14) in Figure 1 moved against the price and the developed downtrend. The momentum indicator formed a stable bottom instead of moving deeper in an oversold area. This indicated a positive divergence against the price movement. With this bullish indication, SHLD formed a morning-star candlestick pattern. The morning star is the formation of three candles -- a bearish candle indicating an existing downtrend, a doji in the middle indicating indecision or confusion among trades, and a bullish candle indicating a forthcoming uptrend. |
| The RSI (14) and the price surged from the lows. The bullish crossover of the moving average convergence/divergence (MACD) (12,26,9) indicated a positive momentum in negative territory. Therefore, the bearish pressure failed and the ADX (14) declined. In Figure 1, we can see the upside journey of the RSI (14) was stopped by resistance at the 50 level as the move was not fully loaded with bullish strength. The trend turned weaker due to equal pressure from the bulls and bears. Therefore, the stock declined to $35.22, forming higher lows. Figure 1 shows a spiraling price movement within the narrow range. SHLD formed a second higher low, with a stable high at the 49-50 area. |

|
| FIGURE 1: SHLD, DAILY. The stock is likely to move in a narrow range until the ascending triangle matures. |
| Graphic provided by: StockCharts.com. |
| |
| At one point, the positive directional index (+DI) and negative directional index (-DI) of ADX (14) converged and tangled, indicating the stock consolidation (see the blue rectangle). As indicated by the ADX (14), the price is consolidating, forming higher lows and a stable top. If we draw two trendlines joining the ascending bottom and the flat top, we can see an ascending triangle being formed. The ascending triangle in the bearish trend is a major reversal signal. The pattern matures as a lower trendline move coincides with the upper trendline and the price breaks in a bullish direction. SHLD in Figure 1 is likely to move in a narrower range until the pattern matures. |
| The RSI (14) has converted the 50 levels' resistance to support, indicating increasing bullish strength. The MACD (12,26,9) has established support over the zero line, that is, positive territory. In addition, the ADX (14) is indicating a developing uptrend with increasing buying pressure. So the possibility of pattern failure is less but cannot be ignored. |
| The bullish consolidation is likely to continue. SHLD would move in a narrower range until the ascending triangle matures. Due to the converging range, the volume would diminish. |
Active trader in the Indian stock markets since 2003 and a full-time writer. Trading is largely based upon technical analysis.
| Company: | Independent |
| Address: | C1/3 Parth Indraprasth Towers. Vastrapur |
| Ahmedabad, Guj 380015 | |
| E-mail address: | chaitalimohile@yahoo.co.in |
Traders' Resource Links | |
| Independent has not added any product or service information to TRADERS' RESOURCE. | |
Click here for more information about our publications!
PRINT THIS ARTICLE

Request Information From Our Sponsors
- StockCharts.com, Inc.
- Candle Patterns
- Candlestick Charting Explained
- Intermarket Technical Analysis
- John Murphy on Chart Analysis
- John Murphy's Chart Pattern Recognition
- John Murphy's Market Message
- MurphyExplainsMarketAnalysis-Intermarket Analysis
- MurphyExplainsMarketAnalysis-Visual Analysis
- StockCharts.com
- Technical Analysis of the Financial Markets
- The Visual Investor
- VectorVest, Inc.
- Executive Premier Workshop
- One-Day Options Course
- OptionsPro
- Retirement Income Workshop
- Sure-Fire Trading Systems (VectorVest, Inc.)
- Trading as a Business Workshop
- VectorVest 7 EOD
- VectorVest 7 RealTime/IntraDay
- VectorVest AutoTester
- VectorVest Educational Services
- VectorVest OnLine
- VectorVest Options Analyzer
- VectorVest ProGraphics v6.0
- VectorVest ProTrader 7
- VectorVest RealTime Derby Tool
- VectorVest Simulator
- VectorVest Variator
- VectorVest Watchdog
