HOT TOPICS LIST
- MACD
- Fibonacci
- RSI
- Gann
- ADXR
- Stochastics
- Volume
- Triangles
- Futures
- Cycles
- Volatility
- ZIGZAG
- MESA
- Retracement
- Aroon
INDICATORS LIST
LIST OF TOPICS
PRINT THIS ARTICLE
by Donald W. Pendergast, Jr.
Is this it? Is this the major low for 2009 for the energy market bear?
Position: Accumulate
Donald W. Pendergast, Jr.
Donald W. Pendergast is a financial markets consultant who offers specialized services to stock brokers and high net worth individuals who seek a better bottom line for their portfolios.
PRINT THIS ARTICLE
REVERSAL
Are Reversals Under Way For Crude Oil and Natural Gas?
01/23/09 08:45:06 AMby Donald W. Pendergast, Jr.
Is this it? Is this the major low for 2009 for the energy market bear?
Position: Accumulate
| For traders who favor commodity-based trading setups (in both the equities and futures markets), the past six or seven months have been like living in the Twilight Zone. All of a sudden, markets that were "destined" to run higher and higher simply collapsed, with hardly a corrective move all the way down. There was a brief short-covering rally early in January 2009, but once that fizzled out, prices dropped again, with crude oil coming close to a new low even as natural gas fell to levels not seen since September 2006. Has anything changed since the summer 2008 energy rout commenced? Perhaps; both the crude oil and natural gas charts suggest that change is in the wind. |

|
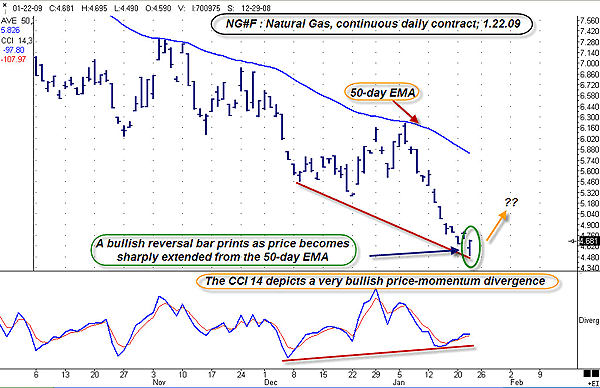
| FIGURE 1: NATURAL GAS, DAILY. A bullish reversal bar, positive price-momentum divergence, favorable COT readings, and an on-time 18-22 bar cycle low all seem to suggest that natural gas may be ready to reverse higher. |
| Graphic provided by: Ensign Windows. |
| |
| The daily natural gas (NG#F, continuous contract) chart (Figure 1) certainly looks about as bearish as it gets, except for the fact that a very convincing bullish reversal bar has just printed, one that has set up at a fairly extreme distance from the 50-day exponential moving average (EMA). Given that the normal 18- to 22-day cycle low is on schedule right about now, and that the monthly price cycle is also at an extremely low point, this reversal setup on the daily chart gains an extra air of bullish credibility. In addition, the commodity channel index (CCI) (14) has printed a very bullish price-momentum divergence; taken all together, natural gas appears ready for a reversal, with duration and intensity unknown. There is another bullish aspect to the natural gas market. According to Commitment of Traders (COT) data, the commercial interests, the big money futures market players who need to buy natural gas to run their businesses, had a superbullish period of accumulation of futures contracts from August 2008 through December 2008. Only now are they lightening up on the acquisition of long positions. Given that natural gas futures have a seasonally bullish bias from late February into late April, they may be giving "ordinary" traders an early warning that an uptrend in gas is coming soon. |

|
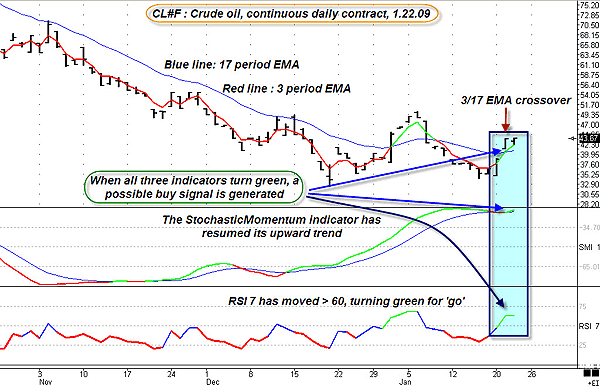
| FIGURE 2: CRUDE OIL, DAILY. A basic trading template is flashing a possible buy signal in crude oil. Given the fact that the series of higher highs and higher lows has already confirmed the uptrend, this three-signal agreement becomes more significant. |
| Graphic provided by: Ensign Windows. |
| |
| Now, it's on to the other main energy market, crude oil, the one that really has everyone baffled as to its next move. Crude appears to have made its major low already, and, in fact, has already traced out a series of higher highs and higher lows, the very definition of an uptrend. On the hard right edge of the chart, note the shaded vertical box; on the particular template I'm using (the "Study Consensus" version in Ensign Windows, which is composed of the 3/17 EMA pair, the stochastic momentum index (SMI) and the relative strength index (RSI)), when all of the indicators turn green, a potential long setup is triggered. Conversely, when all of the indicators turn red, a potential short setup is triggered. Right now, it's all coming in as green, and with crude's monthly price cycle at a near-record low, it's a real possibility that this move will gain some traction, pushing crude oil back up to the $55–60 range before stalling out. |
| If and when natural gas and crude oil begin to start higher again, it's also likely that the shares of companies engaged in the exploration and production of these energy commodities will also experience bullish momentum. Stocks in the energy services industry group — names like Halliburton (HAL), Schlumberger (SLB), and Atwood Oceanics (ATW) — could also be propelled higher in the wake of an energy market recovery. |
Donald W. Pendergast is a financial markets consultant who offers specialized services to stock brokers and high net worth individuals who seek a better bottom line for their portfolios.
| Title: | Writer, market consultant |
| Company: | Linear Trading Systems LLC |
| Jacksonville, FL 32217 | |
| Phone # for sales: | 904-239-9564 |
| E-mail address: | lineartradingsys@gmail.com |
Traders' Resource Links | |
| Linear Trading Systems LLC has not added any product or service information to TRADERS' RESOURCE. | |
Click here for more information about our publications!
Comments
Date: 01/26/09Rank: 4Comment:
Date: 01/26/09Rank: 3Comment:

|

Request Information From Our Sponsors
- VectorVest, Inc.
- Executive Premier Workshop
- One-Day Options Course
- OptionsPro
- Retirement Income Workshop
- Sure-Fire Trading Systems (VectorVest, Inc.)
- Trading as a Business Workshop
- VectorVest 7 EOD
- VectorVest 7 RealTime/IntraDay
- VectorVest AutoTester
- VectorVest Educational Services
- VectorVest OnLine
- VectorVest Options Analyzer
- VectorVest ProGraphics v6.0
- VectorVest ProTrader 7
- VectorVest RealTime Derby Tool
- VectorVest Simulator
- VectorVest Variator
- VectorVest Watchdog
- StockCharts.com, Inc.
- Candle Patterns
- Candlestick Charting Explained
- Intermarket Technical Analysis
- John Murphy on Chart Analysis
- John Murphy's Chart Pattern Recognition
- John Murphy's Market Message
- MurphyExplainsMarketAnalysis-Intermarket Analysis
- MurphyExplainsMarketAnalysis-Visual Analysis
- StockCharts.com
- Technical Analysis of the Financial Markets
- The Visual Investor
