HOT TOPICS LIST
- MACD
- Fibonacci
- RSI
- Gann
- ADXR
- Stochastics
- Volume
- Triangles
- Futures
- Cycles
- Volatility
- ZIGZAG
- MESA
- Retracement
- Aroon
INDICATORS LIST
LIST OF TOPICS
PRINT THIS ARTICLE
by Donald W. Pendergast, Jr.
In the wake of Consol Energy's 84% plunge, the stock of one of the US's largest coal miners is setting up for a low-risk intraday move.
Position: Buy
Donald W. Pendergast, Jr.
Donald W. Pendergast is a financial markets consultant who offers specialized services to stock brokers and high net worth individuals who seek a better bottom line for their portfolios.
PRINT THIS ARTICLE
STOCHASTICS
Consol Energy Intraday Play Based On A Daily Swing Setup
01/22/09 08:24:59 AMby Donald W. Pendergast, Jr.
In the wake of Consol Energy's 84% plunge, the stock of one of the US's largest coal miners is setting up for a low-risk intraday move.
Position: Buy
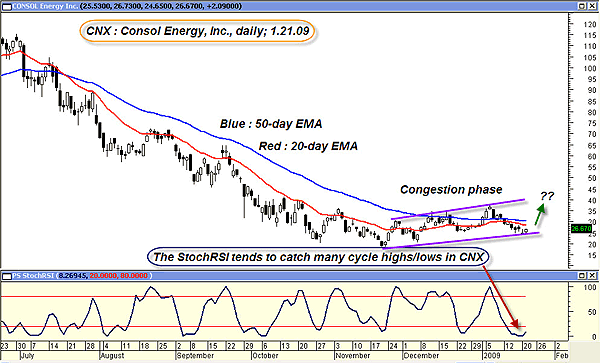
| What's this — $119.10 to $18.50? No, it's not the range of prices on a certain brand of budget mp3 players from China, but rather the June–November 2008 spread of daily stock prices for Consol Energy Inc.(CNX). Consol, based in Canonsburg, PA, is the largest miner of high–British thermal unit (BTU) bituminous coal in the US, and the company is also a leader in the production of coalbed methane gas. It's a giant-sized energy company, one whose stock is certainly a lot more attractive in the mid-$20s than it was near $120. With more than 4.5 billion tons of coal in its huge property base, the company isn't likely to suffer at the hands of a peak coal conspiracy theory anytime soon. CNX's daily chart (Figure 1) is our first stop, so let's see what info we can mine from it. |

|
| FIGURE 1: CNX, DAILY. The stochRSI indicator works well as a cycle-identification tool; stochRSI crossovers that occur when prices are near the 50-day EMA can be especially powerful. |
| Graphic provided by: MetaStock. |
| |
| The daily chart depicts the regular cyclical action of the stochRSI indicator, one of the better momentum tools in the modern technician's arsenal. One effective way to use it is to trade its signal-line crossovers in the direction of the dominant trend, especially when prices are very close to the 50-day exponential moving average (EMA). At present, the stochRSI is very close to a bullish crossover, even as the flattening EMAs have already confirmed the recent consolidation phase. Meanwhile, CNX's monthly chart (not shown here) implies a major cycle low is already in place, while its weekly chart (also not shown) reveals a cycle that's getting long in the tooth. Given the bullish bias in the stock, especially now that the rest of the energy sector is also showing signs of life, we can attempt to craft an interesting and potentially profitable short-term swing trade, one designed to take advantage of the bullish monthly and daily cycle phase without being negatively affected by the stock's extended weekly price cycle. Confused? Just follow along. It gets easier from here: |

|
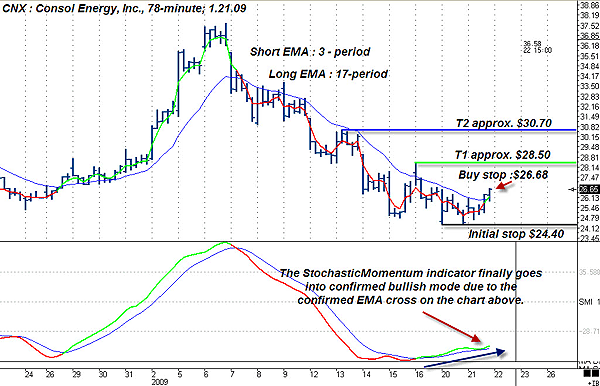
| FIGURE 2: CNX, 78 MINUTES. The stochastic momentum indicator (SMI) frequently works together with 3/17 EMA crossovers to help identify the emergence of trending moves. |
| Graphic provided by: Ensign Windows. |
| |
| In Figure 2, the 78-minute chart (which divides the trading day into five equal segments, unlike a 60-minute chart) more clearly depicts the confirmed cycle low in CNX. Here, I'm using a different variation of the standard stochastic, one called the stochastic momentum indicator (SMI). Calibrated at 10-25-2 with a seven-period EMA, it tends to work well as a trend-following confirmation tool, especially when used with a 3/17 EMA crossover on the price chart. The big idea with using the 78-minute trading time frame is to capitalize on the daily chart's cycle low setup, one that all but ensures that this lower time frame is already in a trending mode. Since we know that CNX's weekly cycle is getting extended on the high side, trading the daily chart doesn't make much sense now, as the stock may not have much room to run before a weekly cycle correction. By using the 78-minute chart to trade when the daily cycle still has room to run gives us a much better shot at locking in a profitable trade setup. Here are the trade setup specifics: |
| Risking no more than 1–2% of account equity (and maybe less), a trader could enter his or her full position on a buy-stop move through $26.68, being sure to place an initial stop just below the recent low at $24.40. More aggressive traders might place their stop a little closer at $24.99. If price reaches target 1 (T1) near $28.50, it is best to take profits on half of the position, moving the stop up to break even. At that point, a three-bar trailing low should be activated. If target 2 (T2) is hit ($30.70 area), the trailing stop should be tightened somewhat, depending on the trader's risk tolerance. Based on the anticipated buy-stop entry, the initial stop, and the T2 price level, this trade offers a risk/reward ratio of approximately 1.8 to 1. With a strengthening energy sector providing a bullish foundation, this seems to be a nice, low-risk setup in CNX. |
| When the price cycles offer conflicting signals across three time frames (daily, weekly, monthly), shrewd traders will sometimes drop down to an intraday chart, seeking the greatest number of harmonious cycle relationships across as many time frames as possible. In this trade example, we identified a bullish agreement among the 78-minute, daily, and monthly price cycles in CNX, which allowed us to craft a trade setup in the lowest time frame of the three. Successful trading requires a great deal of planning, patience, and experience, but for those willing to put in the time and effort, the final results can, at times, be spectacular. |
Donald W. Pendergast is a financial markets consultant who offers specialized services to stock brokers and high net worth individuals who seek a better bottom line for their portfolios.
| Title: | Writer, market consultant |
| Company: | Linear Trading Systems LLC |
| Jacksonville, FL 32217 | |
| Phone # for sales: | 904-239-9564 |
| E-mail address: | lineartradingsys@gmail.com |
Traders' Resource Links | |
| Linear Trading Systems LLC has not added any product or service information to TRADERS' RESOURCE. | |
Click here for more information about our publications!
Comments

Request Information From Our Sponsors
- StockCharts.com, Inc.
- Candle Patterns
- Candlestick Charting Explained
- Intermarket Technical Analysis
- John Murphy on Chart Analysis
- John Murphy's Chart Pattern Recognition
- John Murphy's Market Message
- MurphyExplainsMarketAnalysis-Intermarket Analysis
- MurphyExplainsMarketAnalysis-Visual Analysis
- StockCharts.com
- Technical Analysis of the Financial Markets
- The Visual Investor
- VectorVest, Inc.
- Executive Premier Workshop
- One-Day Options Course
- OptionsPro
- Retirement Income Workshop
- Sure-Fire Trading Systems (VectorVest, Inc.)
- Trading as a Business Workshop
- VectorVest 7 EOD
- VectorVest 7 RealTime/IntraDay
- VectorVest AutoTester
- VectorVest Educational Services
- VectorVest OnLine
- VectorVest Options Analyzer
- VectorVest ProGraphics v6.0
- VectorVest ProTrader 7
- VectorVest RealTime Derby Tool
- VectorVest Simulator
- VectorVest Variator
- VectorVest Watchdog
