HOT TOPICS LIST
- MACD
- Fibonacci
- RSI
- Gann
- ADXR
- Stochastics
- Volume
- Triangles
- Futures
- Cycles
- Volatility
- ZIGZAG
- MESA
- Retracement
- Aroon
INDICATORS LIST
LIST OF TOPICS
PRINT THIS ARTICLE
by Chaitali Mohile
ASEI made a 52-week high but failed to sustain at a new top. Will the declining rally establish support or drift down farther?
Position: N/A
Chaitali Mohile
Active trader in the Indian stock markets since 2003 and a full-time writer. Trading is largely based upon technical analysis.
PRINT THIS ARTICLE
CUP WITH HANDLE
ASEI Retracing Toward Support
01/22/09 10:00:52 AMby Chaitali Mohile
ASEI made a 52-week high but failed to sustain at a new top. Will the declining rally establish support or drift down farther?
Position: N/A
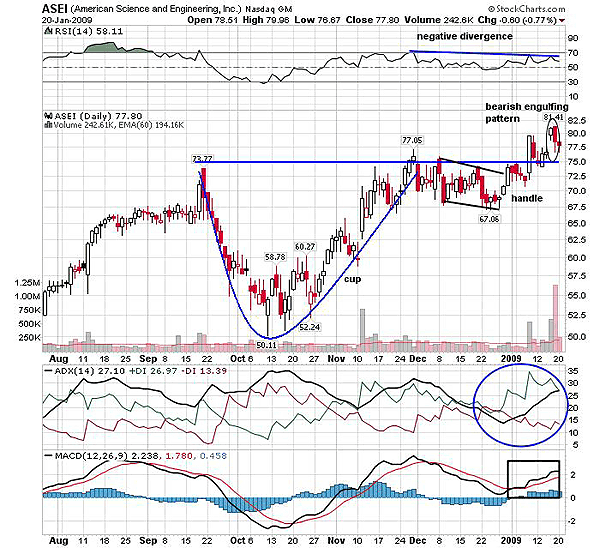
| The cup-with-handle continuation pattern was introduced by William O'Neil in his book How To Make Money In Stocks. The cup resembles a round bottom, and the handle has a slight downward drift. The handle indicates a narrow range consolidation. In Figure 1, American Science and Engineering (ASEI) has a bullish breakout of the cup-with-handle pattern. The average directional movement index (ADX) (14) shows a developing uptrend. For the valid cup-with-handle pattern, the existing uptrend should be moderate and not highly developed. The substantial increase in volume resulted in a successful breakout at $75. |
| The breakout rally made a 52-week high at $80. Although the price made a high, the relative strength index (RSI) (14) formed a negative divergence. The lower highs of the RSI (14) were the first bearish signal. Another reversal sign in Figure 1 is the bearish engulfing candlestick pattern on the price chart. This candlestick pattern indicated the reversal rally in the existing uptrend. Due to this bearish engulfing pattern, ASEI is descending from the new high at $80. But the breakout level at $75 is likely to offer the support to the declining rally. |

|
| FIGURE 1: ASEI, DAILY. ASEI made a 52-week high after the breakout of the cup-with-handle pattern. The bearish engulfing pattern and the negative divergence of the RSI (14) are the two bearish reversal indications. |
| Graphic provided by: StockCharts.com. |
| |
| Although the price is moving down to retest the new support at $75, the indicators have not turned bearish. The RSI (14) is in an overbought area between 70 and 50, indicating bullish strength. The moving average convergence/divergence (MACD) (12,26,9) is equally bullish and comfortably rallying in positive territory above the zero line. This shows a robust momentum in the stock. In addition, the trend is developing steadily, so traders and investors need not worry much about the current descending move. In fact, this decline should be considered as a consolidation that may add bullish strength to the future rally. |
| I would request traders to stay neutral on the stock until strong support is established. The bullish indicators and developing uptrend may lead to a fresh up move from $75 and open low-risk entry for the buyers. Traders should watch the overall market move as well as a sector support to identify a target for the trade. In addition, traders should consider the price movement across the resistance area at $80 (the previous high). |
| Thus, the big picture does not indicate any serious correction below the support at $75. ASEI may soon surge, establishing support. |
Active trader in the Indian stock markets since 2003 and a full-time writer. Trading is largely based upon technical analysis.
| Company: | Independent |
| Address: | C1/3 Parth Indraprasth Towers. Vastrapur |
| Ahmedabad, Guj 380015 | |
| E-mail address: | chaitalimohile@yahoo.co.in |
Traders' Resource Links | |
| Independent has not added any product or service information to TRADERS' RESOURCE. | |
Click here for more information about our publications!
Comments

Request Information From Our Sponsors
- StockCharts.com, Inc.
- Candle Patterns
- Candlestick Charting Explained
- Intermarket Technical Analysis
- John Murphy on Chart Analysis
- John Murphy's Chart Pattern Recognition
- John Murphy's Market Message
- MurphyExplainsMarketAnalysis-Intermarket Analysis
- MurphyExplainsMarketAnalysis-Visual Analysis
- StockCharts.com
- Technical Analysis of the Financial Markets
- The Visual Investor
- VectorVest, Inc.
- Executive Premier Workshop
- One-Day Options Course
- OptionsPro
- Retirement Income Workshop
- Sure-Fire Trading Systems (VectorVest, Inc.)
- Trading as a Business Workshop
- VectorVest 7 EOD
- VectorVest 7 RealTime/IntraDay
- VectorVest AutoTester
- VectorVest Educational Services
- VectorVest OnLine
- VectorVest Options Analyzer
- VectorVest ProGraphics v6.0
- VectorVest ProTrader 7
- VectorVest RealTime Derby Tool
- VectorVest Simulator
- VectorVest Variator
- VectorVest Watchdog
