

HOT TOPICS LIST
- MACD
- Fibonacci
- RSI
- Gann
- ADXR
- Stochastics
- Volume
- Triangles
- Futures
- Cycles
- Volatility
- ZIGZAG
- MESA
- Retracement
- Aroon
INDICATORS LIST
LIST OF TOPICS
PRINT THIS ARTICLE
by Donald W. Pendergast, Jr.
Now that the projected cost of the "New Deal, Part II" is rising by the day, some analysts expect the entire precious metals (PM) complex to soar. Here's a potential channel breakout setup in Kinross Gold Corp.
Position: Accumulate
Donald W. Pendergast, Jr.
Donald W. Pendergast is a financial markets consultant who offers specialized services to stock brokers and high net worth individuals who seek a better bottom line for their portfolios.
PRINT THIS ARTICLE
BREAKOUTS
Channel Breakouts In Kinross Gold Corp.
01/21/09 09:21:07 AMby Donald W. Pendergast, Jr.
Now that the projected cost of the "New Deal, Part II" is rising by the day, some analysts expect the entire precious metals (PM) complex to soar. Here's a potential channel breakout setup in Kinross Gold Corp.
Position: Accumulate
| Having risen more than 136% from their October 2008 low, Kinross Gold Corp. (KGC) shares have been supported by convincing technical measures of money flow. Additional bullish factors affecting this stock (and the rest of the PM stock sector) include the massive global reliquefication of the financial sector by the various central banks. Let's examine two charts, each of which may shed some light on the dynamics driving KGC shares. |
|
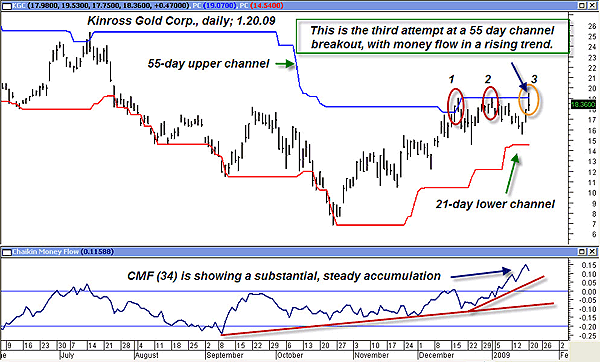
| FIGURE 1: KGC, DAILY. Third time's a charm? Kinross has pulled back after an intraday 21/55-day channel breakout; given the powerful money flow trend, might there be yet another attempt to move higher from the consolidation zone? |
| Graphic provided by: MetaStock. |
| |
| This daily graph of KGC (Figure 1) depicts a stock that keeps banging up against a significant resistance level with increasing frequency, even as its Chaikin money flow (CMF) (34) indicator is demonstrating a tendency toward increasing accumulation. On January 20, KGC briefly broke above the previous $19.01–19.07 resistance zone (points 1 and 2 on the chart), both of which were failed 55-day channel breakout attempts. Price rose as high as $19.53, only to close back below the upper 55-day channel. More important, however, is the fact that money flow has risen substantially since breakout attempts 1 and 2; as prices carved out a consolidation between $14.54–19.07, money was pouring into this stock, as depicted by the CMF. Frequently, this kind of price/moneyflow dynamic is a precursor to a substantial bullish breakout, all else being equal. Clearly, some traders and investor have taken a bullish stance on this stock, acquiring shares with great enthusiasm, especially during the recent consolidation. Now let's look at a different technical measure of bullish sentiment. |
|
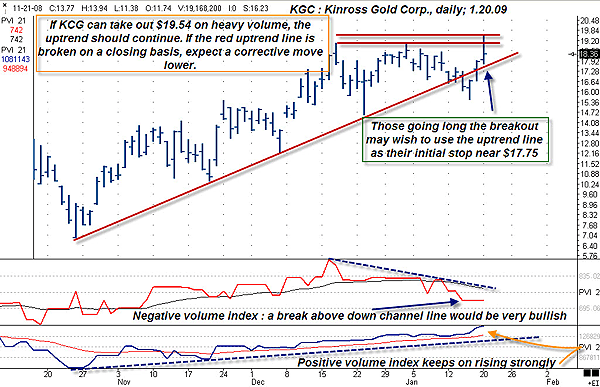
| FIGURE 2: KGC, DAILY. Here's a different view of this stock, this time from a volume analysis stance. While the PVI trend is extremely strong, the NVI may need to play catchup if the trend is to continue higher. |
| Graphic provided by: Ensign Windows. |
| |
| The positive volume index (PVI) and negative volume index (NVI) are two of the most useful technical tools, especially for those who incorporate volume analysis into their methodology. These indicators are simple to understand and simple to use; essentially, the PVI is showing us what price is doing on days of increasing (positive) volume, just as the NVI is depicting what price is doing on days of declining (negative) volume. Like many other indicators, the overall trend of the indicators is the key; many technicians also like to use a moving average to better define trending moves in these indicators. Here, I've applied a 21-period exponential moving average (EMA) to both the PVI and NVI. Typically, when the trend of both indicators are moving in the same direction, the underlying stock/commodity is usually in a powerful trending phase. Right now, the PVI is exhibiting increasing strength, while the PVI is more indecisive. If we see the NVI curl higher, taking out the down channel line, that would be a very strong confirmation that the uptrend still has room to run — as long as the PVI trend is still strong, that is. On the KGC price chart, note that the long-term uptrend line was recently violated, after which the third breakout attempt of the 55-day channel occurred (on January 20). Those traders going long the breakout from $19.54 may wish to use the red up trendline as their initial stop (near $17.75). This setup in KGC also qualifies as a 20-day channel breakout as well, which is interesting inasmuch as the original Turtles trading method used both a 20-day and a 55-day channel breakout system to latch onto various trend-following moves. For what it's worth, both Newmont Mining (NEM) and Agnico-Eagle (AEM) are also close to 55-day channel breakouts, providing additional confirmation for the KGC setup. |
| Money flow and volume analysis are essential technical tools that can make technical analysis much more effective, regardless of which other tools you may use. Apply the CMF, PVI, and NVI to your favorite charts and see if you don't see the markets from a different perspective. |
Donald W. Pendergast is a financial markets consultant who offers specialized services to stock brokers and high net worth individuals who seek a better bottom line for their portfolios.
| Title: | Writer, market consultant |
| Company: | Linear Trading Systems LLC |
| Jacksonville, FL 32217 | |
| Phone # for sales: | 904-239-9564 |
| E-mail address: | lineartradingsys@gmail.com |
Traders' Resource Links | |
| Linear Trading Systems LLC has not added any product or service information to TRADERS' RESOURCE. | |
Click here for more information about our publications!
Comments
Date:�01/21/09Rank:�4Comment:�

Request Information From Our Sponsors
- StockCharts.com, Inc.
- Candle Patterns
- Candlestick Charting Explained
- Intermarket Technical Analysis
- John Murphy on Chart Analysis
- John Murphy's Chart Pattern Recognition
- John Murphy's Market Message
- MurphyExplainsMarketAnalysis-Intermarket Analysis
- MurphyExplainsMarketAnalysis-Visual Analysis
- StockCharts.com
- Technical Analysis of the Financial Markets
- The Visual Investor
- VectorVest, Inc.
- Executive Premier Workshop
- One-Day Options Course
- OptionsPro
- Retirement Income Workshop
- Sure-Fire Trading Systems (VectorVest, Inc.)
- Trading as a Business Workshop
- VectorVest 7 EOD
- VectorVest 7 RealTime/IntraDay
- VectorVest AutoTester
- VectorVest Educational Services
- VectorVest OnLine
- VectorVest Options Analyzer
- VectorVest ProGraphics v6.0
- VectorVest ProTrader 7
- VectorVest RealTime Derby Tool
- VectorVest Simulator
- VectorVest Variator
- VectorVest Watchdog