

HOT TOPICS LIST
- MACD
- Fibonacci
- RSI
- Gann
- ADXR
- Stochastics
- Volume
- Triangles
- Futures
- Cycles
- Volatility
- ZIGZAG
- MESA
- Retracement
- Aroon
INDICATORS LIST
LIST OF TOPICS
PRINT THIS ARTICLE
by Chaitali Mohile
AT&T is rallying under the pressure of strong resistance in a current bear market. The stock can be a best-selling option during its downside journey.
Position: Sell
Chaitali Mohile
Active trader in the Indian stock markets since 2003 and a full-time writer. Trading is largely based upon technical analysis.
PRINT THIS ARTICLE
SUPPORT & RESISTANCE
AT&T Lacks Momentum
01/21/09 01:24:42 PMby Chaitali Mohile
AT&T is rallying under the pressure of strong resistance in a current bear market. The stock can be a best-selling option during its downside journey.
Position: Sell
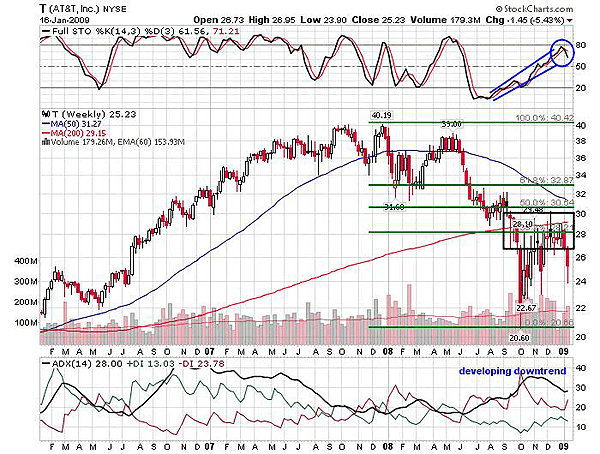
| Since 2006, the 50-day moving average (MA) and the 200-day MA have offered healthy support to the rallies in AT&T (T). The stock made an all-time high at 40.13 and later formed lower highs, indicating a topping-out situation. Thereafter, T entered a bearish phase that turned in a medium-term correction as the stock plunged below the 50-day MA support. The Fibonacci retracement tool used in Figure 1 shows the various support-resistance levels as well as the intensity of the downfall. Another technical tool that indicates the strength in correction is the 200-day MA support. If this support is breached, the stock enters a long-term downtrend. In Figure 1, T has violated both supports, and within the time span of two weeks the stock reached its 2006 low at $20.60. Meanwhile, the average directional movement index (ADX) (14) surged, indicating a well-developed downtrend. The full stochastic (14,3,3) that bounced with the support of 20 levels hit the historical low as well at a highly oversold territory below 20 (see Figure 1). |
| Then $20.60 offered strong historical support, and as a result, T surged toward the 200-day MA resistance. The pullback rally had a rough road due to the declining overheated downtrend indicated by the (ADX) (14). The 200-day MA and 38.2% retracement level resistance in Figure 1 suppressed the upward move. The long upper and lower shadows of the candles indicate the lack of strength to hold the highs as well as the lows. The last two bearish candles in Figure 1 shows the possibility of the stock retracing back to the previous low. Currently, the full stochastic (14,3,3) is reluctant to move above the 80 overbought level. The declining oscillator indicates lack of momentum in the bullish rally; as a result, T might continue to move down further. In addition, the ADX (14) indicates a developing downtrend. |
|
| FIGURE 1: T, WEEKLY. The stock is declining under the resistance of 200-day MA and 38.2% retracement level. |
| Graphic provided by: StockCharts.com. |
| |
| Considering these bearish indicators and the price movement, I would recommend short-selling below the previous close at $25 with the target of a previous low of $20.60, and stop-loss at $28. The best low-risk entry was around $29. Those already holding short positions since $29 can carry the trade with a breakeven stop-loss to protect the money and profit. A breakeven stop-loss means resetting the stop-loss at the entry point of the trade as the trade moves in your favor. Then as the trade moves in profit, shift the stop-loss again to safeguard the profit. So in the current scenario, the breakeven stop-loss for the trade will be $29. Next, to protect the small portion of profit we can order the stop-loss at $27 but not below, as the high volatility might whipsaw you. |
|
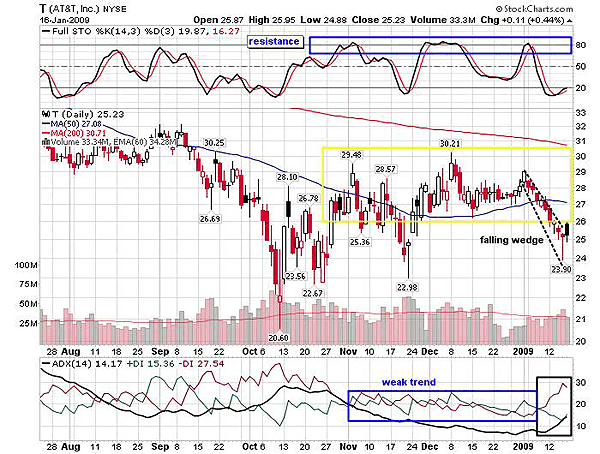
| FIGURE 2: T, DAILY. The falling wedge pattern that is formed is likely to fail as the trend is weak. The ADX (14) indicates increasing selling pressure. |
| Graphic provided by: StockCharts.com. |
| |
| The ADX (14) since November moved below 15, indicating the weak trend and a tough fight between the buyers and sellers (blue marking in Figure 2). The stochastic (14,3,3) moved wildly between 80-20 levels. This resulted in price consolidation in the range of $30-26 (see the yellow rectangle on price chart). Due to the high volatility, the stock breached the lower range twice and bounced back rapidly. Recently, T has slipped below the lower range again. T formed a falling wedge -- a bullish reversal pattern in Figure 2 during the descending rally from the consolidation range. But traders must remember that patterns may fail. Though the falling wedge breaks upward, the increasing selling pressure indicated by negative directional index (-DI) of ADX (14) may hold back the rally. The stochastic oscillator should decisively surge above 20 to initiate a fresh bullish move. |
| Thus, the overall picture is highly bearish. Lack of momentum may drag T to its previous low, opening attractive short-selling opportunities for the traders and investors. |
Active trader in the Indian stock markets since 2003 and a full-time writer. Trading is largely based upon technical analysis.
| Company: | Independent |
| Address: | C1/3 Parth Indraprasth Towers. Vastrapur |
| Ahmedabad, Guj 380015 | |
| E-mail address: | chaitalimohile@yahoo.co.in |
Traders' Resource Links | |
| Independent has not added any product or service information to TRADERS' RESOURCE. | |
Click here for more information about our publications!
Comments
Date:�01/21/09Rank:�5Comment:�

Request Information From Our Sponsors
- StockCharts.com, Inc.
- Candle Patterns
- Candlestick Charting Explained
- Intermarket Technical Analysis
- John Murphy on Chart Analysis
- John Murphy's Chart Pattern Recognition
- John Murphy's Market Message
- MurphyExplainsMarketAnalysis-Intermarket Analysis
- MurphyExplainsMarketAnalysis-Visual Analysis
- StockCharts.com
- Technical Analysis of the Financial Markets
- The Visual Investor
- VectorVest, Inc.
- Executive Premier Workshop
- One-Day Options Course
- OptionsPro
- Retirement Income Workshop
- Sure-Fire Trading Systems (VectorVest, Inc.)
- Trading as a Business Workshop
- VectorVest 7 EOD
- VectorVest 7 RealTime/IntraDay
- VectorVest AutoTester
- VectorVest Educational Services
- VectorVest OnLine
- VectorVest Options Analyzer
- VectorVest ProGraphics v6.0
- VectorVest ProTrader 7
- VectorVest RealTime Derby Tool
- VectorVest Simulator
- VectorVest Variator
- VectorVest Watchdog