HOT TOPICS LIST
- MACD
- Fibonacci
- RSI
- Gann
- ADXR
- Stochastics
- Volume
- Triangles
- Futures
- Cycles
- Volatility
- ZIGZAG
- MESA
- Retracement
- Aroon
INDICATORS LIST
LIST OF TOPICS
PRINT THIS ARTICLE
by Donald W. Pendergast, Jr.
After forming a solid-looking nine-week base, Hecla Mining may be forming a cycle low, one that short-term traders may wish to investigate.
Position: Accumulate
Donald W. Pendergast, Jr.
Donald W. Pendergast is a financial markets consultant who offers specialized services to stock brokers and high net worth individuals who seek a better bottom line for their portfolios.
PRINT THIS ARTICLE
CYCLES
Two Ways To Play Hecla Mining
01/21/09 01:14:13 PMby Donald W. Pendergast, Jr.
After forming a solid-looking nine-week base, Hecla Mining may be forming a cycle low, one that short-term traders may wish to investigate.
Position: Accumulate
| Hecla Mining (HL) has been mining silver in northern Idaho's Silver Valley since 1891 and also has mining operations in Alaska, Colorado, Mexico, and Venezuela. The stock of the company, the oldest US precious metals mining company (and the lowest-cost primary silver producer in North America), has been trading on the NYSE since 1964. Apparently, longevity and stability have little to do with the wild price action of this miner over the past nine months; after peaking at $13.14, HL shares took a toboggan ride off the south side of Mt. Everest before finally cratering to $0.99 this past November. What's the technical state of this stock right now, and how might traders and investors choose to engage the shares of this senior player in the mining industry? |

|
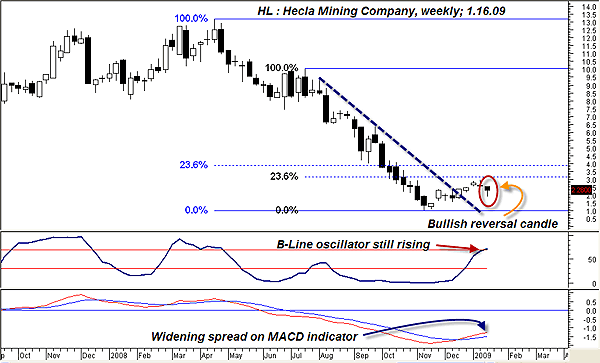
| FIGURE 1: HL, WEEKLY. After completing a major trendline break, the combination of a widening MACD spread, rising price cycle, and bullish reversal candle all seem to imply the possibility of further gains. |
| Graphic provided by: MetaStock. |
| Graphic provided by: WB BLine EOD from ProfitTrader for MetaStock. |
| |
| Hecla's weekly chart (Figure 1) offers a few clues that may suggest that the recovery move higher could still have some room to run. First, there is the rising B-line oscillator, a very reliable cyclical confirmation tool. Then there's the widening spread on the weekly moving average convergence/divergence (MACD) indicator in conjunction with the most recent bullish reversal candle. Prices have initially been turned back by the smaller-degree trend's 23.6% Fibonacci retracement, but given the other three bullish technical factors, the bias appears to favor higher prices in the near term, with the higher-degree trend's 23.6% Fib level (near $3.85) as the most logical initial target. |

|
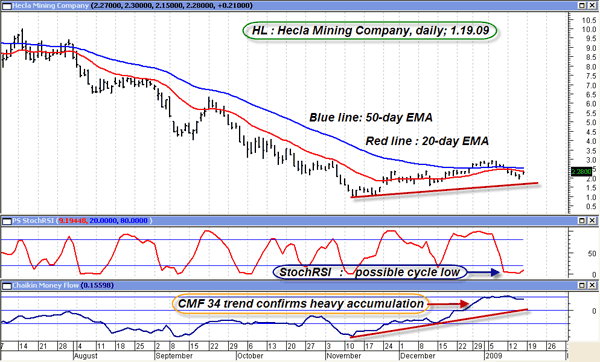
| FIGURE 2: HL, DAILY. Higher highs and lows, a strong CMF 34, and a rising stochRSI indicator each add a bullish tone to this daily chart. |
| Graphic provided by: MetaStock. |
| |
| Dropping down to HL's daily chart (Figure 2), we can get a better idea of the last nine weeks' worth of bottoming/basing action. Here, the imagery is even more bullish, especially for longer-term daily based traders/investors. Prices finally closed above the 50-day exponential moving average (EMA), only recently pulling back. The close proximity of both a relatively flat 20-day and 50-day EMA also confirms the consolidating/basing pattern. A nice series of higher highs/higher lows has also printed, and now the stochRSI indicator is turning higher; if it breaks above its blue signal line, the chances of a continued cycle move higher is probable, especially considering the rest of the technical evidence. Finally, the Chaikin money flow index (CMF) (34) is well above its zero line, confirming the fact that the stock is under sustained accumulation. If you go back in time, you can confirm the strength of the up- and downtrends in this (or any) stock by looking at the general long-term slope of the CMF 34 and its relationship to its zero line. Sustained periods of time spent above (below) the zero line by the CMF 34 almost always confirms the existence of a strong uptrend (downtrend). Check it out on your favorite stocks. |
| So, how to play a potentially bullish continuation move in Hecla Mining stock? Daily based swing traders might want to put half their position on if the January 16th high of $2.30 is taken out, waiting for a pullback on the 30-minute chart to enter the second half of the position. A stop-loss near $2.10 looks like a good make-or-break for this trade. Taking half of the position off if the 50-day EMA (approximately $2.51) is pierced and then trailing the balance with a three-bar trail might also be a good idea; if prices approach the last swing high of $2.95, the stop should be tightened further. Longer-term traders with a firm bullish conviction for HL's future might consider buying one March 2009 $2.50 covered call (buying 100 shares of HL and selling one call against it) for $0.30 or $0.35; if the shares are called away at $2.50 at March expiration, the trade will generate approximately $52-57, which equates to an annual return of close to 100%. If the shares can't stay above $2.50 at expiry, the trader keeps the shares and can sell another call against them, if desired. |
| Given the strong global appetite for investor silver, the downside potential on Hecla stock appears to be minimal in relation to its potential upside, especially now that solid bullish technical patterns are suggesting higher prices in the weeks ahead. Choosing to play Hecla shares on a swing trade or covered call basis offers enterprising traders a sound way to play these probabilities. |
Donald W. Pendergast is a financial markets consultant who offers specialized services to stock brokers and high net worth individuals who seek a better bottom line for their portfolios.
| Title: | Writer, market consultant |
| Company: | Linear Trading Systems LLC |
| Jacksonville, FL 32217 | |
| Phone # for sales: | 904-239-9564 |
| E-mail address: | lineartradingsys@gmail.com |
Traders' Resource Links | |
| Linear Trading Systems LLC has not added any product or service information to TRADERS' RESOURCE. | |
Click here for more information about our publications!
PRINT THIS ARTICLE

Request Information From Our Sponsors
- VectorVest, Inc.
- Executive Premier Workshop
- One-Day Options Course
- OptionsPro
- Retirement Income Workshop
- Sure-Fire Trading Systems (VectorVest, Inc.)
- Trading as a Business Workshop
- VectorVest 7 EOD
- VectorVest 7 RealTime/IntraDay
- VectorVest AutoTester
- VectorVest Educational Services
- VectorVest OnLine
- VectorVest Options Analyzer
- VectorVest ProGraphics v6.0
- VectorVest ProTrader 7
- VectorVest RealTime Derby Tool
- VectorVest Simulator
- VectorVest Variator
- VectorVest Watchdog
- StockCharts.com, Inc.
- Candle Patterns
- Candlestick Charting Explained
- Intermarket Technical Analysis
- John Murphy on Chart Analysis
- John Murphy's Chart Pattern Recognition
- John Murphy's Market Message
- MurphyExplainsMarketAnalysis-Intermarket Analysis
- MurphyExplainsMarketAnalysis-Visual Analysis
- StockCharts.com
- Technical Analysis of the Financial Markets
- The Visual Investor
