HOT TOPICS LIST
- MACD
- Fibonacci
- RSI
- Gann
- ADXR
- Stochastics
- Volume
- Triangles
- Futures
- Cycles
- Volatility
- ZIGZAG
- MESA
- Retracement
- Aroon
INDICATORS LIST
LIST OF TOPICS
PRINT THIS ARTICLE
by Chaitali Mohile
Shaw Group is consolidating after a breakout rally of a rounded bottom.
Position: Buy
Chaitali Mohile
Active trader in the Indian stock markets since 2003 and a full-time writer. Trading is largely based upon technical analysis.
PRINT THIS ARTICLE
ROUND TOP & BOTTOM
Shaw Group Ready To Surge
01/20/09 11:07:44 AMby Chaitali Mohile
Shaw Group is consolidating after a breakout rally of a rounded bottom.
Position: Buy
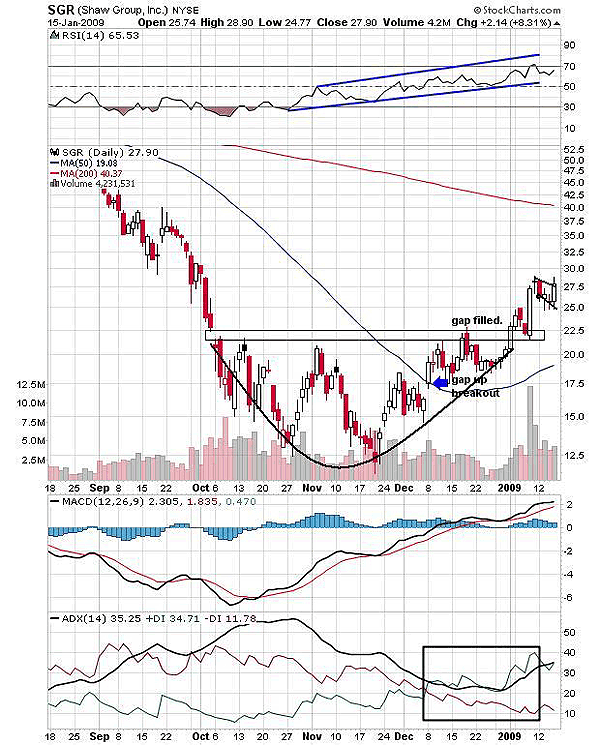
| Shaw Group (SGR) formed a rounded bottom pattern after the gap down in October 2008. The gap down resistance played a key role in constructing the pattern. Earlier, the rally bounced back from the resistance forming lower lows, and then as the new low was formed below 12.5, SGR rallied, making higher lows. The positive divergence of a relative strength index (RSI) (14) indicated the bullish strength in the rally that helped form higher lows. In Figure 1, we can see the volume shows the mirror image of the rounded bottom formation. This pattern is a bullish reversal of the current downtrend, and the breakout is considered above the moving average. Figure 1 shows the gap up breakout of the pattern. The 50-day moving average (MA) resistance was violated with a large gap up opening on December 8. The expanded volume confirmed the breakout and helped SRG to establish strong support at the 50-day MA. |
| The breakout of rounded pattern reversed the downtrend indicated by the average directional movement index (ADX) (14) in Figure 1. After the bullish crossover into deep negative territory, the moving average convergence/divergence (MACD) (12,26,9) has sharply surged above the zero line. This indicates robust momentum in the rally. Due to the increased volume and the bullish indicators, SGR violated the major gap down resistance. The stock retraced to the new support and surged with the huge volume. |

|
| FIGURE 1: SGR, DAILY. The breakout rally of a round-bottom reversal pattern has filled the gap and converted the resistance to support. After rallying higher, SGR is consolidating forming a short-term flag & pennant continuation pattern. |
| Graphic provided by: StockCharts.com. |
| |
| Since the last few trading sessions, SGR is consolidating in the narrow range of 27.5-25. This formed a short-term bullish flag and pennant continuation pattern. The pattern breaks in a bullish direction. The overbought RSI (14) in Figure 1 indicated bullish strength in the rally. The MACD (12,26,9) is positive, and the ADX (14) at the current level indicated a well-developed uptrend. Therefore, the breakout of the flag and pennant pattern will be escorted by the bullish indicators. |
| The potential target is calculated as 27.5 - 22.5 = 5 (length of flag pole) + 28 (breakout level) = 33. Traders can buy SGR only after the confirmed breakout above 28 levels with the estimated target of 33. The 200-day MA would be the next target for the breakout rally. But the volatile financial markets may not allow a single-direction rally, so I would request traders to take profits at every possible level. |
Active trader in the Indian stock markets since 2003 and a full-time writer. Trading is largely based upon technical analysis.
| Company: | Independent |
| Address: | C1/3 Parth Indraprasth Towers. Vastrapur |
| Ahmedabad, Guj 380015 | |
| E-mail address: | chaitalimohile@yahoo.co.in |
Traders' Resource Links | |
| Independent has not added any product or service information to TRADERS' RESOURCE. | |
Click here for more information about our publications!
Comments
Date: 01/21/09Rank: 3Comment:

Request Information From Our Sponsors
- StockCharts.com, Inc.
- Candle Patterns
- Candlestick Charting Explained
- Intermarket Technical Analysis
- John Murphy on Chart Analysis
- John Murphy's Chart Pattern Recognition
- John Murphy's Market Message
- MurphyExplainsMarketAnalysis-Intermarket Analysis
- MurphyExplainsMarketAnalysis-Visual Analysis
- StockCharts.com
- Technical Analysis of the Financial Markets
- The Visual Investor
- VectorVest, Inc.
- Executive Premier Workshop
- One-Day Options Course
- OptionsPro
- Retirement Income Workshop
- Sure-Fire Trading Systems (VectorVest, Inc.)
- Trading as a Business Workshop
- VectorVest 7 EOD
- VectorVest 7 RealTime/IntraDay
- VectorVest AutoTester
- VectorVest Educational Services
- VectorVest OnLine
- VectorVest Options Analyzer
- VectorVest ProGraphics v6.0
- VectorVest ProTrader 7
- VectorVest RealTime Derby Tool
- VectorVest Simulator
- VectorVest Variator
- VectorVest Watchdog
