HOT TOPICS LIST
- MACD
- Fibonacci
- RSI
- Gann
- ADXR
- Stochastics
- Volume
- Triangles
- Futures
- Cycles
- Volatility
- ZIGZAG
- MESA
- Retracement
- Aroon
INDICATORS LIST
LIST OF TOPICS
PRINT THIS ARTICLE
by Donald W. Pendergast, Jr.
Still down more than 86% from its November 2006 high, US Airways stock now appears to be under accumulation by the smart money.
Position: Accumulate
Donald W. Pendergast, Jr.
Donald W. Pendergast is a financial markets consultant who offers specialized services to stock brokers and high net worth individuals who seek a better bottom line for their portfolios.
PRINT THIS ARTICLE
MONEY FLOW INDEX
LCC Stock Under Steady Accumulation
01/20/09 09:44:05 AMby Donald W. Pendergast, Jr.
Still down more than 86% from its November 2006 high, US Airways stock now appears to be under accumulation by the smart money.
Position: Accumulate
| Sometimes, even the most seasoned chartist does a double-take, making sure that what his eyes see as he scans his or her favorite technical charts is really there. US Airways (LCC) is an airline that currently has negative earnings per share, it offers no dividend, and it faces intense competition from other commercial airlines, many of which are struggling for survival. So what is it about LCC shares that would cause them to rated "accumulate"? |

|
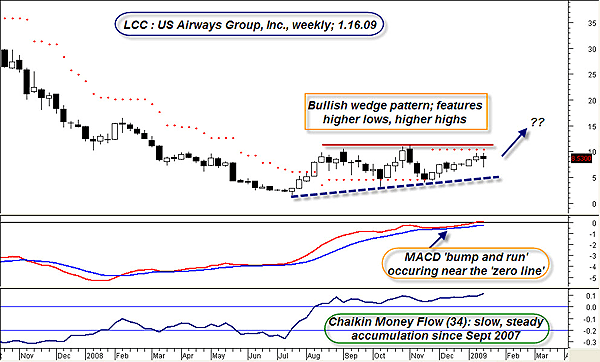
| FIGURE 1: LCC, WEEKLY. A combination of money flow, higher highs/higher lows, price consolidation, and MACD action, not to mention low energy prices, may have all enabled this airline stock to build a solid base from which to launch higher. |
| Graphic provided by: MetaStock. |
| |
| The answer can be found here in LCC's weekly graph. According to the Chaikin money flow (CMF)(34) indicator, US Airways stock began manifesting signs of accumulation as early as September 2007 even as the share prices were still declining. Essentially, it means that over a period of time, the enthusiasm of value investors began to slowly overpower the fear of those unloading shares into the market. Typically, mutual funds and other institutional investors are the ones to make the first moves toward deploying funds into such beaten-down stocks, and US Airways certainly appears to have been on their acquisition list. There can be little doubt that the massive slide in energy prices has also contributed to the greatly accelerated rate of share accumulation since July 2008; note how the CMF 34 jumped higher during July–August 2008 and how it keeps rising even throughout the period of pronounced price consolidation on the chart. Other bullish technical clues that suggest LCC may be poised to run higher include the series of higher lows/higher highs and the bump-and-run pattern on the moving average convergence/divergence indicator (MACD), one that occurs right near the zero line. One final technical to watch is the volatility stop, noted by the red dotted lines on Figure 1. Many times, when prices decisively break above a 2.5 * average true range (ATR)(10) volatility stop (particularly after a well-defined period of basing and/or consolidation), a new trend comes into play. In this case, a break above $10.40 on a weekly close would be especially bullish, considering the price pattern projection implied by the wedge. So how to play this weekly setup in LCC? I have an idea for those who wouldn't mind acquiring US Airways shares at a significant discount. |
| As of Friday, January 16, 2009, a February 2009 LCC $5 put option could be sold for about $20 (0.20). A trader bullish on the long-term prospects for LCC would be able to pick up 100 shares of LCC for $500 less the $20 in premium collected, but only if LCC closes below $5 at February expiration. That's $4.80 per share, not including commissions, a discount of 43% from Friday's close of $8.44. Those who wouldn't mind a little more risk could sell a March 2009 LCC $5 put for about $0.50, reducing the potential cost of share ownership all the way down to $4.50, a 47% discount. Again, LCC needs to close below $5 at March expiration in order to acquire the shares. |
| What if LCC breaks higher, what then? Well, the value of the short puts will plummet, enabling a nimble trader to buy them back, hopefully for a fraction of the cost they were sold for. Given the volatile nature of the airline industry, energy prices, and the economy in general, buying back short puts for a quick profit might be the most prudent course of action, especially for those not interested in actually owning the underlying stock. |
Donald W. Pendergast is a financial markets consultant who offers specialized services to stock brokers and high net worth individuals who seek a better bottom line for their portfolios.
| Title: | Writer, market consultant |
| Company: | Linear Trading Systems LLC |
| Jacksonville, FL 32217 | |
| Phone # for sales: | 904-239-9564 |
| E-mail address: | lineartradingsys@gmail.com |
Traders' Resource Links | |
| Linear Trading Systems LLC has not added any product or service information to TRADERS' RESOURCE. | |
Click here for more information about our publications!
PRINT THIS ARTICLE

Request Information From Our Sponsors
- StockCharts.com, Inc.
- Candle Patterns
- Candlestick Charting Explained
- Intermarket Technical Analysis
- John Murphy on Chart Analysis
- John Murphy's Chart Pattern Recognition
- John Murphy's Market Message
- MurphyExplainsMarketAnalysis-Intermarket Analysis
- MurphyExplainsMarketAnalysis-Visual Analysis
- StockCharts.com
- Technical Analysis of the Financial Markets
- The Visual Investor
- VectorVest, Inc.
- Executive Premier Workshop
- One-Day Options Course
- OptionsPro
- Retirement Income Workshop
- Sure-Fire Trading Systems (VectorVest, Inc.)
- Trading as a Business Workshop
- VectorVest 7 EOD
- VectorVest 7 RealTime/IntraDay
- VectorVest AutoTester
- VectorVest Educational Services
- VectorVest OnLine
- VectorVest Options Analyzer
- VectorVest ProGraphics v6.0
- VectorVest ProTrader 7
- VectorVest RealTime Derby Tool
- VectorVest Simulator
- VectorVest Variator
- VectorVest Watchdog
