HOT TOPICS LIST
- MACD
- Fibonacci
- RSI
- Gann
- ADXR
- Stochastics
- Volume
- Triangles
- Futures
- Cycles
- Volatility
- ZIGZAG
- MESA
- Retracement
- Aroon
INDICATORS LIST
LIST OF TOPICS
PRINT THIS ARTICLE
by Paolo Pezzutti
Prices may have initiated an A-B-C correction.
Position: N/A
Paolo Pezzutti
Author of the book "Trading the US Markets - A Comprehensive Guide to US Markets for International Traders and Investors" - Harriman House (July 2008)
PRINT THIS ARTICLE
TECHNICAL ANALYSIS
30-Year US Treasury Bonds Uptrend Losing Strength
01/20/09 09:34:28 AMby Paolo Pezzutti
Prices may have initiated an A-B-C correction.
Position: N/A
| Several analysts are warning about the next big asset bubble — US Treasuries. In fact, yields have plunged to lowest levels in decades as investors, in a typical flight-to-safety approach, fearful of a sustained recession and deflation, have purchased government-issued debt. |

|
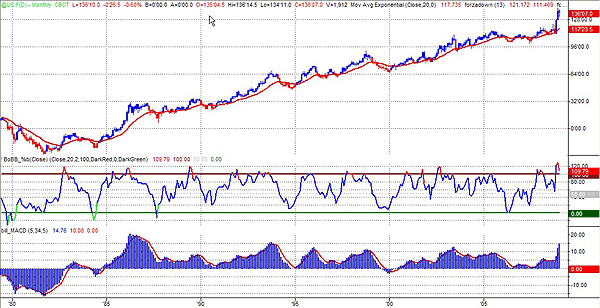
| FIGURE 1: 30-YEAR US TREASURY BONDS, MONTHLY. Bonds have been in an uptrend for many years. |
| Graphic provided by: TradeStation. |
| |
| Since the beginning of November and quite impressively, prices of the 30-year US Treasury bonds future contract (US.P) have moved from about 112 to a high above 140 in December. The warning is coming after the surge of prices, but if you look at the longer picture (Figure 1), you can see the long uptrend started in the 1980s. Treasuries have been quite a good investment so far. |

|
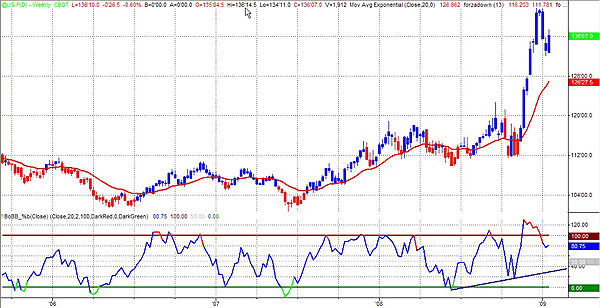
| FIGURE 2: 30-YEAR US TREASURY BONDS, WEEKLY. Bonds printed an impressive up move between November and December 2008. |
| Graphic provided by: TradeStation. |
| |
| I used the force index indicator, which is an indicator measuring the force of bulls during uptrends and the force of bears in downtrends. It takes into account price and volume. I applied a 13-day exponential moving average (EMA) of the force index to help track the trend. When the trend is positive, the color is blue; when the trend is negative, the color is red. I applied also the %b indicator, which is derived from the Bollinger bands. It measures where the last price is in relation to the bands and it is used to tell us where we are within the bands. |

|
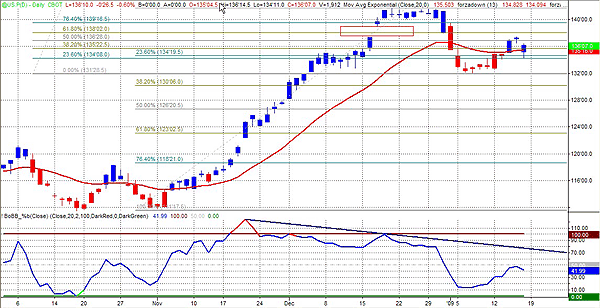
| FIGURE 1: 30-YEAR US TREASURY BONDS, DAILY. The closure of the exhaustion up gap has inititated a correction. |
| Graphic provided by: TradeStation. |
| |
| In the weekly time frame (Figure 2), the trend according to the force index is still positive. The %b left the overbought level and prices after a bearish candlestick pattern printed at the top. At the daily level (Figure 3), the force index indicates a continuing uptrend, while %b has printed a negative divergence in coincidence with the December top and toward the oversold level. The gap printed on December 17 has proved to be an exhaustion gap. In fact, days immediately after the gap, the Treasury futures contract developed a congestion, then closed the gap and printed a first leg to the downside that retraced about 30% of the steep up move. Prices had a rebound from January 7 to January 15, retracing more than 55% of the first correction. Note that the rebound lasted so far seven bars while the leg to the downside were developed in only five bars. The longer move developed about half the distance in price. This shows that bulls are still trying to push prices higher, but their action is losing effect. Moreover, the rebound reached the level from where prices gapped on December 17. The area of the gap represents a resistance, and a closure of the gap would imply a likely retest of the top. |
| Assuming that the medium-term uptrend in bonds is still ongoing, the present correction could develop in an A-B-C pattern. The futures contract in this scenario could have printed waves A and B and could be about to develop a second leg to the downside in the form of wave C. I would not open a long trade on Treasuries, although in this moment both the weekly and daily time frames indicate that an uptrend is ongoing. I see too much risk to the downside. Instead, to open a short trade there are several options. A bearish pattern in the coming days could provide the trigger with a stop-loss above 137. Or it is possible to anticipate and sell short next to resistance levels, should prices continue to move up in the next sessions? |
Author of the book "Trading the US Markets - A Comprehensive Guide to US Markets for International Traders and Investors" - Harriman House (July 2008)
| Address: | VIA ROBERTO AGO 26 POSTAL CODE 00166 |
| Rome, ITALY | |
| Phone # for sales: | +393357540708 |
| E-mail address: | pezzutti.paolo@tiscali.it |
Click here for more information about our publications!
Comments
Date: 01/21/09Rank: 5Comment:

Request Information From Our Sponsors
- StockCharts.com, Inc.
- Candle Patterns
- Candlestick Charting Explained
- Intermarket Technical Analysis
- John Murphy on Chart Analysis
- John Murphy's Chart Pattern Recognition
- John Murphy's Market Message
- MurphyExplainsMarketAnalysis-Intermarket Analysis
- MurphyExplainsMarketAnalysis-Visual Analysis
- StockCharts.com
- Technical Analysis of the Financial Markets
- The Visual Investor
- VectorVest, Inc.
- Executive Premier Workshop
- One-Day Options Course
- OptionsPro
- Retirement Income Workshop
- Sure-Fire Trading Systems (VectorVest, Inc.)
- Trading as a Business Workshop
- VectorVest 7 EOD
- VectorVest 7 RealTime/IntraDay
- VectorVest AutoTester
- VectorVest Educational Services
- VectorVest OnLine
- VectorVest Options Analyzer
- VectorVest ProGraphics v6.0
- VectorVest ProTrader 7
- VectorVest RealTime Derby Tool
- VectorVest Simulator
- VectorVest Variator
- VectorVest Watchdog
