HOT TOPICS LIST
- MACD
- Fibonacci
- RSI
- Gann
- ADXR
- Stochastics
- Volume
- Triangles
- Futures
- Cycles
- Volatility
- ZIGZAG
- MESA
- Retracement
- Aroon
INDICATORS LIST
LIST OF TOPICS
PRINT THIS ARTICLE
by Chaitali Mohile
The price of Chemed has gapped down from the lower ascending trendline. Will this breakdown open fresh short-selling positions?
Position: Sell
Chaitali Mohile
Active trader in the Indian stock markets since 2003 and a full-time writer. Trading is largely based upon technical analysis.
PRINT THIS ARTICLE
SYMMETRICAL TRIANGLE
Chemed Corp. Breakdown
01/19/09 11:57:21 AMby Chaitali Mohile
The price of Chemed has gapped down from the lower ascending trendline. Will this breakdown open fresh short-selling positions?
Position: Sell
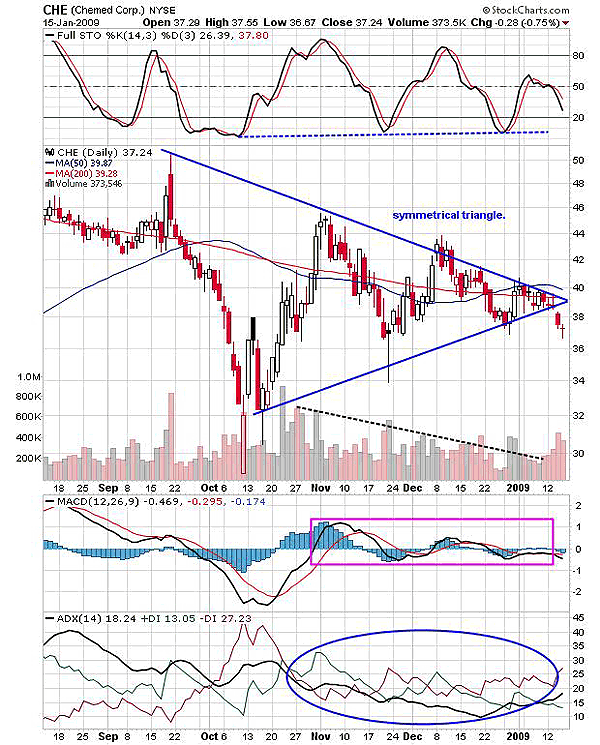
| The symmetrical triangle, sometimes known as the "coil," is formed by two converging trendlines, indicating lower tops and higher bottoms. The price may move out either upward or downward from this pattern. Although the formation is most common on the technical charts, it is highly difficult to trade. No clue on the part of a breakout is available until the price decisively breaks out. In Figure 1, Chemed Corp. (CHE) was forming a symmetrical triangle since September-October 2008. The volume, as we can see, has diminished due to the two converging trendlines. The trendlines converge due to the lower highs and higher lows. After the long volatile trading sessions, the triangle finally has broken down with a small gap on January 14. |

|
| FIGURE 1: CHE, DAILY. The symmetrical triangle has a gap-down breakout. The breakout rally may test the newly formed resistance line at 38. |
| Graphic provided by: StockCharts.com. |
| |
| Due to the gap down, the momentum indicators on the chart may become bearish. In Figure 1, the stochastic (14,3,3) has a lower top, but a stable support in the oversold area below the 20 level. Currently, the stochastic (14,3,3) is declining, forming another lower top under the resistance of the 50 level. The moving average convergence/divergence (MACD) (12,26,9) shows shaky moves near the zero line, indicating high volatility. After a long fight with the trigger line, the moving average convergence/divergence (MACD) (12,26,9) may undergo a bearish crossover (look for a confirmed crossover during the trade). The average directional movement index (ADX) (14) indicates the possibility of a developing downtrend above the 20 level. This could add significant pressure on the breakdown rally, and CHE may plunge to the previous lows. |
| Hence, traders can look for fresh short selling opportunity below 36, as the price may turn back to test the freshly formed resistance of a lower trendline at 38. The stop-loss for the trade would be 40, and the short-term target is the first support level at 34 (see Figure 1). The breakout may fail if the price moves above 40, so a short trade can be entered only below 36. |

|
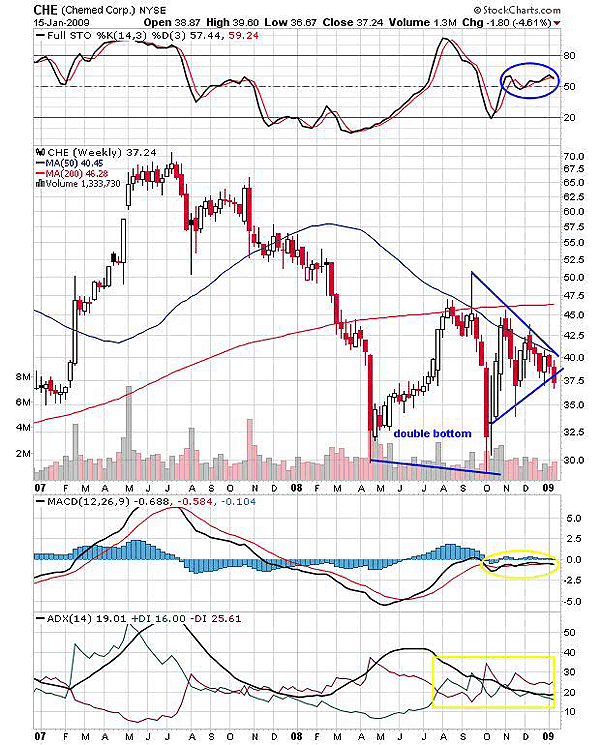
| FIGURE 2: CHE, WEEKLY. The symmetrical triangle is formed on a weekly time frame as well. |
| Graphic provided by: StockCharts.com. |
| |
| The bullish rally was twice restricted by the 200-day moving average (MA). We can see a double-bottom reversal pattern formed in Figure 2. But the rally that was initiated by this pattern failed under the 200-day MA and formed lower peaks and higher bottoms. Thus, a symmetrical triangle is formed on the weekly chart as well (Figure 2). The pattern is recognized as stronger if it appears on the two different time frames of the same stock/index. Therefore, the symmetrical triangle of CHE is strong, and so is the breakout. In addition, the stochastic (14,3,3) as well as the MACD (12,26,9) failed to move in a positive area. As a result, the symmetrical triangle is Figure 2 saw a gap down breakout. The trend indicated by ADX (14) is weak, so the breakdown rally may turn highly bearish in such conditions. Thus, traders and investors can surely short the position with the above-mentioned target and the stop-loss. The long-term target considering Figure 2 could be 30. But I would remain alert at the first target level of 34. |
| Considering the bearish notes on both technical charts of CHE, the breakdown can be traded. |
Active trader in the Indian stock markets since 2003 and a full-time writer. Trading is largely based upon technical analysis.
| Company: | Independent |
| Address: | C1/3 Parth Indraprasth Towers. Vastrapur |
| Ahmedabad, Guj 380015 | |
| E-mail address: | chaitalimohile@yahoo.co.in |
Traders' Resource Links | |
| Independent has not added any product or service information to TRADERS' RESOURCE. | |
Click here for more information about our publications!
Comments
Date: 01/19/09Rank: 2Comment:

Request Information From Our Sponsors
- StockCharts.com, Inc.
- Candle Patterns
- Candlestick Charting Explained
- Intermarket Technical Analysis
- John Murphy on Chart Analysis
- John Murphy's Chart Pattern Recognition
- John Murphy's Market Message
- MurphyExplainsMarketAnalysis-Intermarket Analysis
- MurphyExplainsMarketAnalysis-Visual Analysis
- StockCharts.com
- Technical Analysis of the Financial Markets
- The Visual Investor
- VectorVest, Inc.
- Executive Premier Workshop
- One-Day Options Course
- OptionsPro
- Retirement Income Workshop
- Sure-Fire Trading Systems (VectorVest, Inc.)
- Trading as a Business Workshop
- VectorVest 7 EOD
- VectorVest 7 RealTime/IntraDay
- VectorVest AutoTester
- VectorVest Educational Services
- VectorVest OnLine
- VectorVest Options Analyzer
- VectorVest ProGraphics v6.0
- VectorVest ProTrader 7
- VectorVest RealTime Derby Tool
- VectorVest Simulator
- VectorVest Variator
- VectorVest Watchdog
