HOT TOPICS LIST
- MACD
- Fibonacci
- RSI
- Gann
- ADXR
- Stochastics
- Volume
- Triangles
- Futures
- Cycles
- Volatility
- ZIGZAG
- MESA
- Retracement
- Aroon
INDICATORS LIST
LIST OF TOPICS
PRINT THIS ARTICLE
by Donald W. Pendergast, Jr.
It's 40 below in some parts of the US, but natural gas prices haven't seemed to notice — until now.
Position: Accumulate
Donald W. Pendergast, Jr.
Donald W. Pendergast is a financial markets consultant who offers specialized services to stock brokers and high net worth individuals who seek a better bottom line for their portfolios.
PRINT THIS ARTICLE
CHART ANALYSIS
Signs Of A Reversal In UNG?
01/16/09 08:49:09 AMby Donald W. Pendergast, Jr.
It's 40 below in some parts of the US, but natural gas prices haven't seemed to notice — until now.
Position: Accumulate
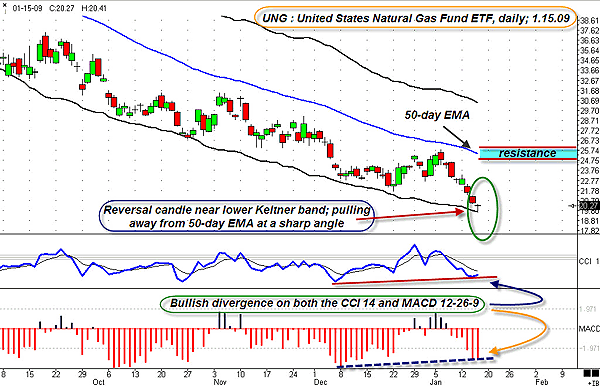
| Natural gas has endured a massive selloff since the high of summer 2008, but now things are beginning to look a little more positive for this essential energy commodity. UNG, the US Natural Gas Fund exchange traded fund (ETF), is an equity designed to mimic the movements of various natural gas futures contracts, and right now it's sending out some interesting chart signals (see Figure 1). |

|
| FIGURE 1: UNG, DAILY. The combination of a reversal candle, positive divergences, and favorable seasonal tendencies are lending a very bullish tone to this particular market. |
| Graphic provided by: Ensign Windows. |
| |
| For almost five months, UNG has faithfully stayed within the range established by its downward-sloping 50-day exponential moving average (EMA) and its lower Keltner band. Volatility has been gradually dissipating, but until now, UNG has been unable to establish a meaningful low. At first glance, some traders might simply dismiss this equity's chances of reversing anytime soon, but that might be a mistake. For one thing, note how price approached the 50-day EMA and then pulled away at a sharp downward angle before forming a bullish reversal candle right at the lower Keltner band. Now see the twin bullish divergence patterns on both the commodity channel index (CCI)(14)and the moving average convergence/divergence (MACD); when you combine all of this technical imagery, the foundation for a trend reversal seems to have fallen into place. |
| Obviously, with so much overhead resistance areas to deal with, any reversal higher will face some tough sledding, but given the fact that natural gas typically makes a major seasonal low (for the past 19 years, anyway) from January to mid-March, followed by a strong surge higher into the latter part of April, also enhances the bullish chances of this setup. |
| How to play this? If at all, with a very small amount of capital — swing traders might choose to risk about 0.5% of account equity on this one, going long on a rise above January 15's reversal candle. The obvious profit target is the January 6th swing high or the 50-day EMA, whichever is hit first. Longer-term, fundamentally driven investors may prefer to scale in, putting on a small initial position, before adding additional positions on pullbacks, especially now that the monthly price cycle in natural gas has essentially hit rock bottom. |
| It's an exciting time to be a trader, with so many new kinds of exchange-traded equity products being developed and marketed. The day may come when every commodity will be represented in the stock market with its very own ETF. Who would have ever believed this to be possible 10 years ago? |
Donald W. Pendergast is a financial markets consultant who offers specialized services to stock brokers and high net worth individuals who seek a better bottom line for their portfolios.
| Title: | Writer, market consultant |
| Company: | Linear Trading Systems LLC |
| Jacksonville, FL 32217 | |
| Phone # for sales: | 904-239-9564 |
| E-mail address: | lineartradingsys@gmail.com |
Traders' Resource Links | |
| Linear Trading Systems LLC has not added any product or service information to TRADERS' RESOURCE. | |
Click here for more information about our publications!
Comments
Date: 01/19/09Rank: 4Comment:

Request Information From Our Sponsors
- StockCharts.com, Inc.
- Candle Patterns
- Candlestick Charting Explained
- Intermarket Technical Analysis
- John Murphy on Chart Analysis
- John Murphy's Chart Pattern Recognition
- John Murphy's Market Message
- MurphyExplainsMarketAnalysis-Intermarket Analysis
- MurphyExplainsMarketAnalysis-Visual Analysis
- StockCharts.com
- Technical Analysis of the Financial Markets
- The Visual Investor
- VectorVest, Inc.
- Executive Premier Workshop
- One-Day Options Course
- OptionsPro
- Retirement Income Workshop
- Sure-Fire Trading Systems (VectorVest, Inc.)
- Trading as a Business Workshop
- VectorVest 7 EOD
- VectorVest 7 RealTime/IntraDay
- VectorVest AutoTester
- VectorVest Educational Services
- VectorVest OnLine
- VectorVest Options Analyzer
- VectorVest ProGraphics v6.0
- VectorVest ProTrader 7
- VectorVest RealTime Derby Tool
- VectorVest Simulator
- VectorVest Variator
- VectorVest Watchdog
