HOT TOPICS LIST
- MACD
- Fibonacci
- RSI
- Gann
- ADXR
- Stochastics
- Volume
- Triangles
- Futures
- Cycles
- Volatility
- ZIGZAG
- MESA
- Retracement
- Aroon
INDICATORS LIST
LIST OF TOPICS
PRINT THIS ARTICLE
by James Kupfer
Gold is continuing to drop. Where might it find support?
Position: N/A
James Kupfer
Mr. Kupfer is a market professional and amateur stock market commentator. Disclosure: It is likely that Mr. Kupfer has or will enter a position in any security he writes about.
PRINT THIS ARTICLE
FIBONACCI
Golden Support Levels
01/16/09 08:40:25 AMby James Kupfer
Gold is continuing to drop. Where might it find support?
Position: N/A
| Even though gold recently broke out of its long-term channel to the upside, on January 8, I made that case that gold was actually a sell/short candidate and said, "I think it is likely that the top has now been made." At the time, gold was at $858/oz. Since then, gold has dropped on a closing basis to below $812/oz. So is now a time to cover shorts? |
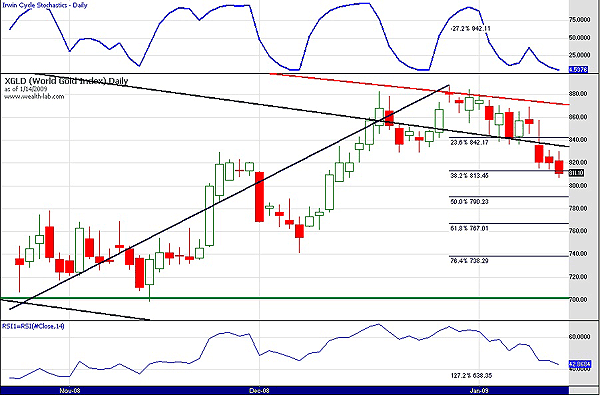
| Of course, this answer depends on your time horizon, but for swing traders the answer is no, not yet. Gold is now breaking below the 38.2% Fibonacci support level formed between the October 2008 low and the December 2008 high. The relative strength index (RSI) is also trending down without any divergences from price that might indicate underlying strength in the stock. See Figure 1. |

|
| FIGURE 1: XGLD, DAILY. Gold is weak and seems to be getting weaker. |
| Graphic provided by: Wealth-lab. |
| |
| On the long side, the stochastics do show that gold is deeply oversold. Of course, oversold can continue to become even more oversold, so that itself is not a buy signal. In short, there is no compelling reason to cover short positions yet. The best opportunities for gold to have a very short-term rally lie at the 50%, 61.8%, and 76.4% Fibonacci support levels. |
| Longer term, however, I estimate that gold will eventually drop back to the bottom of its long-term channel. That would take it to below $700. |
Mr. Kupfer is a market professional and amateur stock market commentator. Disclosure: It is likely that Mr. Kupfer has or will enter a position in any security he writes about.
Click here for more information about our publications!
Comments
Date: 01/19/09Rank: 5Comment:
Date: 01/20/09Rank: 3Comment:

Request Information From Our Sponsors
- StockCharts.com, Inc.
- Candle Patterns
- Candlestick Charting Explained
- Intermarket Technical Analysis
- John Murphy on Chart Analysis
- John Murphy's Chart Pattern Recognition
- John Murphy's Market Message
- MurphyExplainsMarketAnalysis-Intermarket Analysis
- MurphyExplainsMarketAnalysis-Visual Analysis
- StockCharts.com
- Technical Analysis of the Financial Markets
- The Visual Investor
- VectorVest, Inc.
- Executive Premier Workshop
- One-Day Options Course
- OptionsPro
- Retirement Income Workshop
- Sure-Fire Trading Systems (VectorVest, Inc.)
- Trading as a Business Workshop
- VectorVest 7 EOD
- VectorVest 7 RealTime/IntraDay
- VectorVest AutoTester
- VectorVest Educational Services
- VectorVest OnLine
- VectorVest Options Analyzer
- VectorVest ProGraphics v6.0
- VectorVest ProTrader 7
- VectorVest RealTime Derby Tool
- VectorVest Simulator
- VectorVest Variator
- VectorVest Watchdog
