HOT TOPICS LIST
- MACD
- Fibonacci
- RSI
- Gann
- ADXR
- Stochastics
- Volume
- Triangles
- Futures
- Cycles
- Volatility
- ZIGZAG
- MESA
- Retracement
- Aroon
INDICATORS LIST
LIST OF TOPICS
PRINT THIS ARTICLE
by James Kupfer
A short-term bottom is likely in the works for the Dow Jones Industrial Average.
Position: Accumulate
James Kupfer
Mr. Kupfer is a market professional and amateur stock market commentator. Disclosure: It is likely that Mr. Kupfer has or will enter a position in any security he writes about.
PRINT THIS ARTICLE
DJIA Ready To Bounce
01/16/09 08:35:34 AMby James Kupfer
A short-term bottom is likely in the works for the Dow Jones Industrial Average.
Position: Accumulate
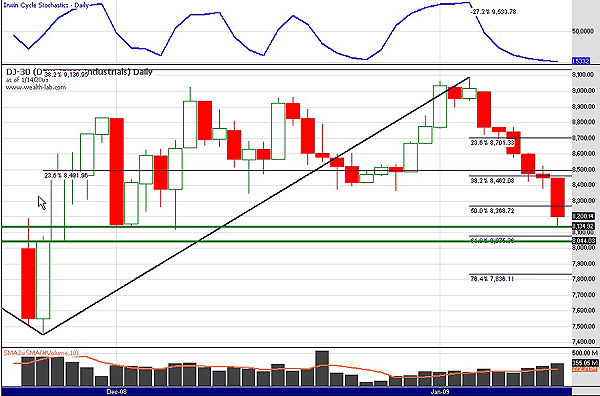
| On January 9, I suggested that traders sell the Dow Jones 30 and said, "Is the rally in the Dow Jones 30 done for? Analysis of multiple indicators would indicate that it likely is." Since then, the DJ30 has not had a single up day and now stands at 8043 as of this writing. |
| Now, however, the tables are turning once again and the DJ30 looks ready to put in a short-term bottom and turn back up. Let us examine the indicators (Figure 1). |

|
| FIGURE 1: DJIA, DAILY. Increasing volume on this decline is not a good sign for long positions, but the selling now appears to be overdone. |
| Graphic provided by: Wealth-lab. |
| |
| First, daily stochastics is deeply oversold with a reading of just 1.5. Second, after moving down for seven days straight, logic would indicate that at least one up day is called for soon. Third, the DJ30 is now between the two green support lines shown on Figure 1 formed from previous lows. Fourth, inside of the green support zone is the 61.8 Fibonacci support level formed from between the October 2008 lows and the recent January 2009 highs. |
| The thing about any market, especially a bear market like we are in, is that any oversold condition can become even more oversold. However, given the convergence of the support levels and oversold condition, it seems like a reasonable conclusion to draw that the market will bounce today or tomorrow and retrace a good percentage of the recent down move. Should that occur, it might well provide another good opportunity to enter short positions for the likely next big move down. |
Mr. Kupfer is a market professional and amateur stock market commentator. Disclosure: It is likely that Mr. Kupfer has or will enter a position in any security he writes about.
Click here for more information about our publications!
Comments
Date: 01/19/09Rank: 4Comment:

|

Request Information From Our Sponsors
- StockCharts.com, Inc.
- Candle Patterns
- Candlestick Charting Explained
- Intermarket Technical Analysis
- John Murphy on Chart Analysis
- John Murphy's Chart Pattern Recognition
- John Murphy's Market Message
- MurphyExplainsMarketAnalysis-Intermarket Analysis
- MurphyExplainsMarketAnalysis-Visual Analysis
- StockCharts.com
- Technical Analysis of the Financial Markets
- The Visual Investor
- VectorVest, Inc.
- Executive Premier Workshop
- One-Day Options Course
- OptionsPro
- Retirement Income Workshop
- Sure-Fire Trading Systems (VectorVest, Inc.)
- Trading as a Business Workshop
- VectorVest 7 EOD
- VectorVest 7 RealTime/IntraDay
- VectorVest AutoTester
- VectorVest Educational Services
- VectorVest OnLine
- VectorVest Options Analyzer
- VectorVest ProGraphics v6.0
- VectorVest ProTrader 7
- VectorVest RealTime Derby Tool
- VectorVest Simulator
- VectorVest Variator
- VectorVest Watchdog
