

HOT TOPICS LIST
- MACD
- Fibonacci
- RSI
- Gann
- ADXR
- Stochastics
- Volume
- Triangles
- Futures
- Cycles
- Volatility
- ZIGZAG
- MESA
- Retracement
- Aroon
INDICATORS LIST
LIST OF TOPICS
PRINT THIS ARTICLE
by Donald W. Pendergast, Jr.
After rising more than 105% since the October 2008 lows, USEC may now be offering an intraday short setup.
Position: Sell
Donald W. Pendergast, Jr.
Donald W. Pendergast is a financial markets consultant who offers specialized services to stock brokers and high net worth individuals who seek a better bottom line for their portfolios.
PRINT THIS ARTICLE
CYCLES
A Cycle Peak And An Intraday Setup
01/15/09 09:40:06 AMby Donald W. Pendergast, Jr.
After rising more than 105% since the October 2008 lows, USEC may now be offering an intraday short setup.
Position: Sell
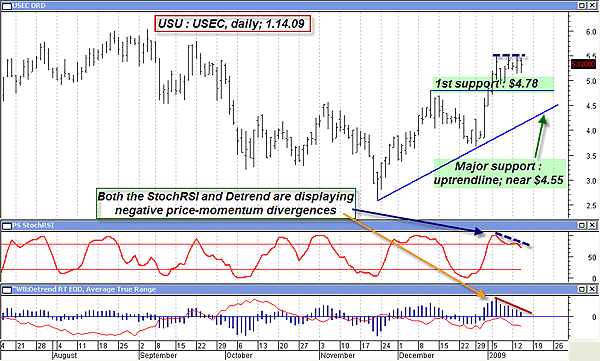
| USEC, Inc. (USU), supplies enriched uranium to various nuclear power plant facilities around the globe. Overall, the future looks very bright for the nuclear power industry; hundreds of new power plants are already in the planning stages and there are dozens already under construction worldwide. The stock has held up pretty well over the past few sessions, despite several down days in the broad markets. Now, however, the stock appears to have completed a meaningful daily cycle high and may be offering nimble traders the opportunity to take a shot at a short sale on its 60-minute chart. A glance at USU's daily graph is our first order of business (Figure 1). |
|
| FIGURE 1: USU, DAILY. Bearish price-momentum divergences may be warning of a pullback toward $4.78 and/or $4.55, prices coincident with significant Fibonacci retracement levels. |
| Graphic provided by: MetaStock. |
| Graphic provided by: WBDetrendEOD from ProfitTrader for MetaStock. |
| |
| Nothing here but simple geometry and negative price-momentum divergence; USU is clearly in a meaningful uptrend, but even the most powerful trends need time to correct and/or consolidate before (hopefully) moving higher. The StochRSI indicator, a hybrid mating of the relative strength index (RSI) and stochastic indicators, can be useful in determining various price cycles. It tends to work best on stocks that tend to make fairly smooth wave-like moves and appears to be a good fit with USU's current price pattern. The StochRSI and the detrend oscillator (another cycle identification tool) are both manifesting signs of negative price-momentum divergence, alerting long positions to either take profits and/or tighten stops. The horizontal blue line at $4.78 (also the prior swing high) is the 38.2% Fibonacci retracement level and should offer some support if prices break lower. If that level is broken, expect a move down to test the blue uptrend line, probably near $4.50-4.60. That's also the Fibonacci 50% retracement area and will also likely offer major support. There are some other clues and confirmations that also tend to support the timing of a short sale in USU; USU is sitting just shy of its 50-week exponential moving average (EMA) even as its parent, the Market Vectors Nuclear Energy (NLR) exchange traded fund (ETF), is already moving lower. In addition, the broad markets are beginning to roll over and may continue to be driven lower over the next few sessions. Let's drill down to USU's 60-minute chart for more specifics on how aggressive, nimble traders might play a move lower in this stock (Figure 2). |
|
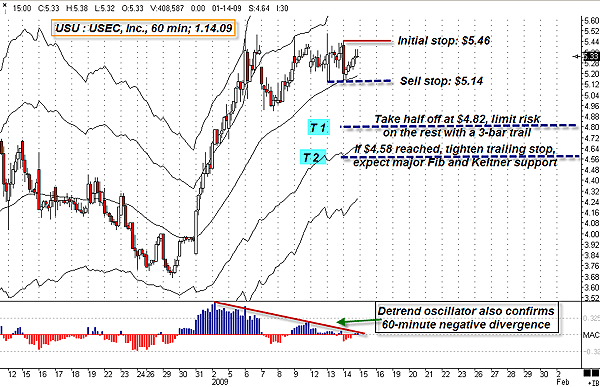
| FIGURE 2: USU, HOURLY. Keltner band price action warns of a weakening trend; a break below $5.14 is the trigger price for a potential short entry. A price target of $4.58 translates to a 1.75-to-1 risk/reward ratio, based on the posted entry and initial stop prices. |
| Graphic provided by: Ensign Windows. |
| |
| A different time frame with different technical metrics can help us home in on a strategy to take advantage of anticipated weakness in this stock. Note how the outer Keltner band acted as powerful resistance on January 6; after being turned back lower, prices began to consolidate. The inner Keltner band also acted as strong resistance on January 9, another warning sign that the trend was rapidly losing steam. The detrend oscillator is also showing a substantial negative price-momentum divergence, so our next step is to choose a meaningful entry trigger price, initial stop price, and price targets. For the entry, a break below Wednesday's low at $5.15 is the doorway for the trade; use a sell-stop order at $5.14 and then place an initial stop near $5.46, risking no more than 1-2% of your account size. If filled and USU drops to $4.82-$4.78, take half the position off and bring the stop to break even. This should help limit some of the risk of a short-covering snapback. Note that $4.78 is the prior swing high price and the Fibonacci 38.2% retracement of the recent upswing, a logical place to take some money off the table, especially if short. Using a two- or three-bar trailing stop might work well at that point (should it get that far) to limit risk and lock in profits if the downdraft were to continue. And $4.50-4.60 is likely to be a major support level, one that could be a launchpad for a short-covering move back up from the major uptrend line. If prices continue to drop toward $4.50-4.60, consider taking more profits and/or tightening up the trailing stop. If we calculate $4.55 as a logical target for the entire move, that translates into a risk/reward ratio of better than 1.8 to 1, not bad for an intraday trade setup. If you're developing an image in your mind that planning for a swing trade setup is similar to the process that a football coach uses as he chalks out his play strategies, well, you're right. In our case, the opposition isn't another team, it's the different support/resistance levels, divergences, swing ratios, and price cycles that are the tangible obstacles trying to prevent us from gaining meaningful ground en route to a significant financial score. Thinking of trading as a football game sounds bizarre at first, but you might be surprised at how it will align your thought processes with the flow of market movements. Try it. It works. |
| Will USU drop below $5.15, triggering an entry into this short setup? It's impossible to say right now, but the weight of the technical evidence seems to favor some sort of pullback in this unique energy-related stock. |
Donald W. Pendergast is a financial markets consultant who offers specialized services to stock brokers and high net worth individuals who seek a better bottom line for their portfolios.
| Title: | Writer, market consultant |
| Company: | Linear Trading Systems LLC |
| Jacksonville, FL 32217 | |
| Phone # for sales: | 904-239-9564 |
| E-mail address: | lineartradingsys@gmail.com |
Traders' Resource Links | |
| Linear Trading Systems LLC has not added any product or service information to TRADERS' RESOURCE. | |
Click here for more information about our publications!
Comments
Date:�01/15/09Rank:�5Comment:�

Request Information From Our Sponsors
- VectorVest, Inc.
- Executive Premier Workshop
- One-Day Options Course
- OptionsPro
- Retirement Income Workshop
- Sure-Fire Trading Systems (VectorVest, Inc.)
- Trading as a Business Workshop
- VectorVest 7 EOD
- VectorVest 7 RealTime/IntraDay
- VectorVest AutoTester
- VectorVest Educational Services
- VectorVest OnLine
- VectorVest Options Analyzer
- VectorVest ProGraphics v6.0
- VectorVest ProTrader 7
- VectorVest RealTime Derby Tool
- VectorVest Simulator
- VectorVest Variator
- VectorVest Watchdog
- StockCharts.com, Inc.
- Candle Patterns
- Candlestick Charting Explained
- Intermarket Technical Analysis
- John Murphy on Chart Analysis
- John Murphy's Chart Pattern Recognition
- John Murphy's Market Message
- MurphyExplainsMarketAnalysis-Intermarket Analysis
- MurphyExplainsMarketAnalysis-Visual Analysis
- StockCharts.com
- Technical Analysis of the Financial Markets
- The Visual Investor