HOT TOPICS LIST
- MACD
- Fibonacci
- RSI
- Gann
- ADXR
- Stochastics
- Volume
- Triangles
- Futures
- Cycles
- Volatility
- ZIGZAG
- MESA
- Retracement
- Aroon
INDICATORS LIST
LIST OF TOPICS
PRINT THIS ARTICLE
by Donald W. Pendergast, Jr.
Has crude oil finally bottomed? The technical and fundamental evidence says "Definitely maybe." Bottom or not, here's a low-risk swing trading setup in USO.
Position: Buy
Donald W. Pendergast, Jr.
Donald W. Pendergast is a financial markets consultant who offers specialized services to stock brokers and high net worth individuals who seek a better bottom line for their portfolios.
PRINT THIS ARTICLE
VALLEY & PEAK
Bullish Divergences, Daily Swing Trading Opportunity For USO
01/14/09 08:49:07 AMby Donald W. Pendergast, Jr.
Has crude oil finally bottomed? The technical and fundamental evidence says "Definitely maybe." Bottom or not, here's a low-risk swing trading setup in USO.
Position: Buy
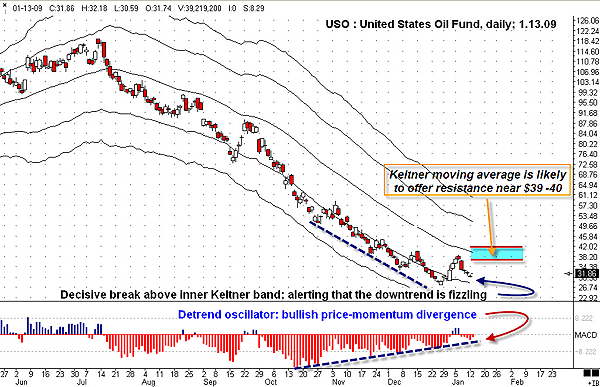
| I read an informative article a while back by a noted statistician, in which he wrote that the incredible trending moves up and down in crude oil over the past two years are without precedent; not even the "peak oil" theory nor the deleveraging phenomenon provide sufficient statistical or fundamental basis for the fact that these once-in-a-lifetime trend moves occurred in direct sequence, with nary a period of consolidation separating the two. You just have to wonder what other forces may have been at work in this commodity market over the past two years. Here are two interesting charts of the US Oil Fund (USO), an exchange traded fund (ETF) that offers equity traders the opportunity to participate in the crude oil market without having to trade futures contracts. Figure 1 will give us an overview of the bottoming process in USO. |

|
| FIGURE 1: USO, DAILY. An interesting combination of Keltner band dynamics and bullish price-momentum divergence imply that USO's line of least resistance may be higher, perhaps toward the blue resistance zone. |
| Graphic provided by: Ensign Windows. |
| |
| Keltner bands are a powerful analytical tool that technicians use to help identify breakouts, support/resistance levels, and price-momentum divergences. In this USO chart, note how prices clung to the inner Keltner band as the second wave of the momentous selloff gathered steam from October through December 2008. Finally, as 2009 began, a powerful short-covering rally kicked into gear, driving USO substantially above the inner Keltner band, a very bullish omen. Meanwhile, the detrend oscillator was telegraphing that a prodigious positive price-momentum divergence was also under way, typical before a market makes a major trend reversal. Right now, prices are between the inner band and the Keltner moving average; typically, the moving average acts as strong support/resistance, so it's likely that a swing move higher will temporarily stall near $39–40 (the zone highlighted by blue shaded rectangle). Let's look at one more chart before we get into the actual nuts and bolts of the swing trade setup (Figure 2). |

|
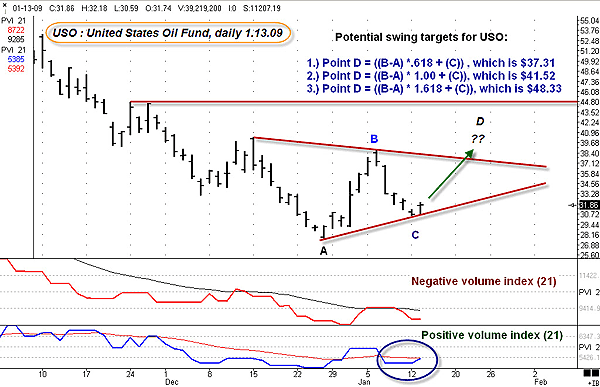
| FIGURE 2: USO, DAILY. A well-formed pennant and supportive volume indexes can help provide a swing trader with a bullish technical framework with which to forecast potential price targets. |
| Graphic provided by: Ensign Windows. |
| |
| There's a lot going on here, but all vibrations are definitely bullish; for starters, the pennant is pointing to potentially higher prices. A breakout above the upper channel could mean a trip up toward $45 or higher. That's exciting enough, but here's a confluence area, one calculated by comparing the minimum D swing target of $37.31 with the approximate convergence price where swing D will likely hit the upper channel line of the pennant, which also happens to be near $37.50. Sometimes, when two different technical tools each forecast a similar price target, the tradable in question begins to be drawn like a magnet toward that price zone, and this could be one of those magic moments. If the pennant is cleared with heavy volume and a wide range thrust, the next swing target at $41.52 becomes a very real possibility. While not likely to be achieved in one unbroken trend move, I've included the extended target for swing D at $48.33. If the shorts in the oil markets begin to close up shop in a hurry, heading out of town, then a jolt up to that extended target could actually be a possibility. But only time will tell. (By the way, all of the formulas needed to establish tentative swing targets are posted on the chart. Play with them and see if they can help you with your price forecasts in the markets you follow.) Need more bullish technical evidence? Check out the positive volume index (with a 21-period moving average). Note the circled area covering the last few days of trading action. Even though the pullback in USO was sharp and swift, the PVI stayed relatively flat. That's a tendency more indicative of a pullback in an emerging bull market than it is of a fresh, fear-propelled selloff in an established bear market. Here are the specifics for the swing trade setup: |
| Risking no more than 1% to 2% of your account equity, go long USO on a buy-stop at $32.20, placing a protective stop-loss just below the red trendline; $30.45 should be a good make-or-break stop, as it's just below the most recent valley. If filled on the buy-stop, sell a third of your position once you've recovered your risk. If the distance between your fill and initial stop is $1.75, if the trade moves up by $1.75, take a third of your position off. Now, trail the balance of the position with a three-bar trailing stop, taking off half of the remaining position if the pennant's upper channel line is hit. Should price keep on going without any stopout, let the position run with the same three-bar trail, especially since the second swing target has a real possibility of being reached, if the pennant is successfully breached. More aggressive traders might want to attempt to hold their entire position in anticipation of a strong runup to the pennant channel line, being sure to bring their stopup to break even more quickly than scale-out traders, who will most likely stay with the trailing stop throughout the anticipated move. There are dozens of ways to manage a swing trade; those are just two strategies to consider. Which strategy you choose depends on your skill level, technical savvy, and market intuition, which, when all is said and done, is perhaps the most important trading talent of all. While that elusive, sixth-sense awareness known as "gut feel" can be developed over time, some people are inherently more gifted in that area than others and as such, they maintain an almost unfair advantage over 99% of all other traders. |
Donald W. Pendergast is a financial markets consultant who offers specialized services to stock brokers and high net worth individuals who seek a better bottom line for their portfolios.
| Title: | Writer, market consultant |
| Company: | Linear Trading Systems LLC |
| Jacksonville, FL 32217 | |
| Phone # for sales: | 904-239-9564 |
| E-mail address: | lineartradingsys@gmail.com |
Traders' Resource Links | |
| Linear Trading Systems LLC has not added any product or service information to TRADERS' RESOURCE. | |
Click here for more information about our publications!
Comments
Date: 01/15/09Rank: 5Comment:

Request Information From Our Sponsors
- VectorVest, Inc.
- Executive Premier Workshop
- One-Day Options Course
- OptionsPro
- Retirement Income Workshop
- Sure-Fire Trading Systems (VectorVest, Inc.)
- Trading as a Business Workshop
- VectorVest 7 EOD
- VectorVest 7 RealTime/IntraDay
- VectorVest AutoTester
- VectorVest Educational Services
- VectorVest OnLine
- VectorVest Options Analyzer
- VectorVest ProGraphics v6.0
- VectorVest ProTrader 7
- VectorVest RealTime Derby Tool
- VectorVest Simulator
- VectorVest Variator
- VectorVest Watchdog
- StockCharts.com, Inc.
- Candle Patterns
- Candlestick Charting Explained
- Intermarket Technical Analysis
- John Murphy on Chart Analysis
- John Murphy's Chart Pattern Recognition
- John Murphy's Market Message
- MurphyExplainsMarketAnalysis-Intermarket Analysis
- MurphyExplainsMarketAnalysis-Visual Analysis
- StockCharts.com
- Technical Analysis of the Financial Markets
- The Visual Investor
