HOT TOPICS LIST
- MACD
- Fibonacci
- RSI
- Gann
- ADXR
- Stochastics
- Volume
- Triangles
- Futures
- Cycles
- Volatility
- ZIGZAG
- MESA
- Retracement
- Aroon
INDICATORS LIST
LIST OF TOPICS
PRINT THIS ARTICLE
by Ron Walker
After a recent encounter with the rising minor trendline, the bears managed to run roughshod over the bulls, puncturing a hole in the minor rising trendline on the QQQQ's hourly chart. But a secondary trendline may be just the springboard needed to bolster the bulls.
Position: N/A
Ron Walker
Ron Walker is an active trader and technical analyst. He operates an educational website dedicated to the study of Technical Analysis. The website offers free market analysis with daily video presentations and written commentaries. Ron is a video pioneer, being one of the first to utilize the internet producing Technical Analysis videos. His website is thechartpatterntrader.com
PRINT THIS ARTICLE
The QQQQ Tests Its Secondary Trendline
01/13/09 08:50:22 AMby Ron Walker
After a recent encounter with the rising minor trendline, the bears managed to run roughshod over the bulls, puncturing a hole in the minor rising trendline on the QQQQ's hourly chart. But a secondary trendline may be just the springboard needed to bolster the bulls.
Position: N/A
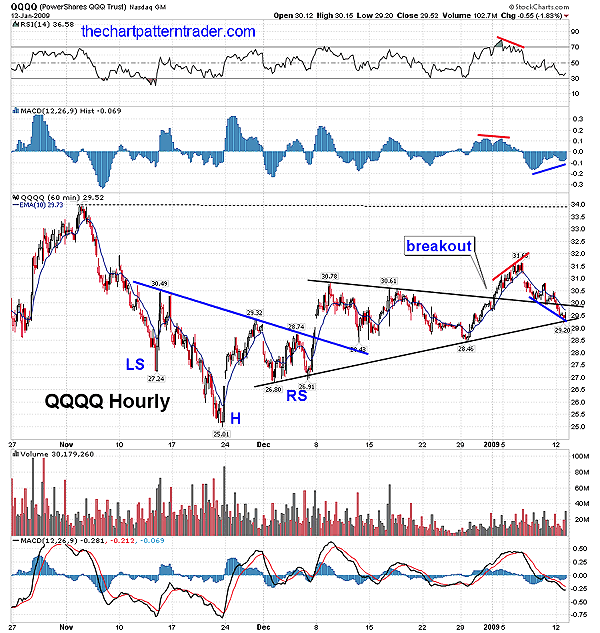
| The exchange traded fund (ETF) QQQQ has been in an uptrend since its bottom on November 21. In Figure 1, you will note that once that bottom formed on the hourly chart, prices swiftly rallied up to the $29 dollar level that formed a downward-sloping trendline. After that move, prices threw back to $26.80, then QQQQ attempted another go at moving above that trendline. But prices stalled there once again a few days later. Finally, during its third attempt, the QQQQ was successful in taking out the trendline of resistance. That sloping trendline that appeared on the QQQQ hourly chart formed the neckline for a inverse head & shoulders pattern. |

|
| FIGURE 1: QQQQ, HOURLY. The QQQQ broke out of a symmetrical triangle pattern on January 2. Shortly after that a bearish divergence formed, throwing prices back into the triangle to test its lower boundary once again. |
| Graphic provided by: StockCharts.com. |
| |
| Prices then backtested the neckline of the pattern successfully and proceeded to move sideways, carving out a symmetrical triangle pattern. And on January 2, the QQQQ broke out of its triangle pattern. Shortly after the breakout, negative divergence formed between the price chart and the relative strength index (RSI) (14), causing prices to drift back down into the triangle near its apex. A divergence has formed between price and the moving average convergence/divergence (MACD) histogram at that level of support, which may allow a bounce to occur off these levels. |

|
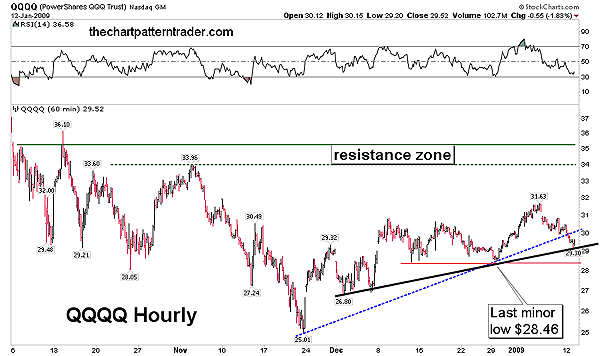
| FIGURE 2: QQQQ, HOURLY. Here we see that the minor trendline has been fractured. But a secondary trendline is now being tested, with horizontal support just below that at $28.46. If support holds, prices will challenge the last minor high of $31.63, and if successful, they could rise to the resistance zone. |
| Graphic provided by: StockCharts.com. |
| |
| In Figure 2, a minor trendline was previously erected on the 60-minute chart of QQQQ that connected the last minor low with November 21. However, the QQQQ stumbled below its minor trendline on the hourly chart, causing prices to creep back down to a secondary trendline of support. The lower boundary of the symmetrical triangle is that secondary trendline of support. Now, even though the minor trend has been taken out, we still have higher lows on the price chart. As long as the prices do not make a lower low, the uptrend remains in full force. The uptrend can only be officially broken if prices make a lower low. So far, the hourly chart still has higher highs and higher lows, the character traits of an uptrend. |
| The QQQQ is at a crucial level of support. If the secondary trend is punctured, then prices will fall to test the last minor low at $28.46 made on December 29. If prices tumble below that last minor low, then the odds favor that the QQQQ will revisit its November low. Remaining above its secondary trendline will isolate it from further erosion and perhaps rejuvenate the advance, bringing about price stability. Right now, prices continue to struggle and limp along, inflicted by the technical damage done to the previous minor trendline. The QQQQ needs to gain some traction off either the secondary trendline or at its last minor low if the bulls expect to stay in power. If the QQQQ gets the traction it needs, a redraw of trendline will be in order off the November lows. |
| I am giving the uptrend the benefit of the doubt and anticipating that the advance will continue once prices have put yet another higher low. Should buyers support this secondary trendline, then we should get another attempt at a higher high. Assuming that the secondary trendline holds, and that price goes on to make higher highs, then prices may ultimately be carried up to the November 4 high near $34 or another barrier of resistance just above it near $35 (Figure 2). This is a major resistance zone for the QQQQ, and in all likelihood it will extinguish the advance. I don't think price will have the perseverance to move much higher than the resistance zone. The price target is arrived on the triangle by subtracting the lowest point from highest point in the pattern, and then by adding it to the pivot point where prices break out, a target can be calculated. Interestingly, the triangle measures $3.98, and when you add that to the pivot point at $30.20, we arrive at a minimum projected target for the pattern of $34.18. That is right in line with key resistance. |
Ron Walker is an active trader and technical analyst. He operates an educational website dedicated to the study of Technical Analysis. The website offers free market analysis with daily video presentations and written commentaries. Ron is a video pioneer, being one of the first to utilize the internet producing Technical Analysis videos. His website is thechartpatterntrader.com
| Website: | thechartpatterntrader.com |
| E-mail address: | thechartpatterntrader@gmail.com |
Click here for more information about our publications!
Comments
Date: 01/13/09Rank: 3Comment:

Request Information From Our Sponsors
- StockCharts.com, Inc.
- Candle Patterns
- Candlestick Charting Explained
- Intermarket Technical Analysis
- John Murphy on Chart Analysis
- John Murphy's Chart Pattern Recognition
- John Murphy's Market Message
- MurphyExplainsMarketAnalysis-Intermarket Analysis
- MurphyExplainsMarketAnalysis-Visual Analysis
- StockCharts.com
- Technical Analysis of the Financial Markets
- The Visual Investor
- VectorVest, Inc.
- Executive Premier Workshop
- One-Day Options Course
- OptionsPro
- Retirement Income Workshop
- Sure-Fire Trading Systems (VectorVest, Inc.)
- Trading as a Business Workshop
- VectorVest 7 EOD
- VectorVest 7 RealTime/IntraDay
- VectorVest AutoTester
- VectorVest Educational Services
- VectorVest OnLine
- VectorVest Options Analyzer
- VectorVest ProGraphics v6.0
- VectorVest ProTrader 7
- VectorVest RealTime Derby Tool
- VectorVest Simulator
- VectorVest Variator
- VectorVest Watchdog
