HOT TOPICS LIST
- MACD
- Fibonacci
- RSI
- Gann
- ADXR
- Stochastics
- Volume
- Triangles
- Futures
- Cycles
- Volatility
- ZIGZAG
- MESA
- Retracement
- Aroon
INDICATORS LIST
LIST OF TOPICS
PRINT THIS ARTICLE
by Chaitali Mohile
Companhia Vale do Rio Doce is range-bound for the past couple of months. Will the consolidation lead to a strong bottom formation?
Position: N/A
Chaitali Mohile
Active trader in the Indian stock markets since 2003 and a full-time writer. Trading is largely based upon technical analysis.
PRINT THIS ARTICLE
SUPPORT & RESISTANCE
Rio Forming Bottom?
01/12/09 01:46:10 PMby Chaitali Mohile
Companhia Vale do Rio Doce is range-bound for the past couple of months. Will the consolidation lead to a strong bottom formation?
Position: N/A
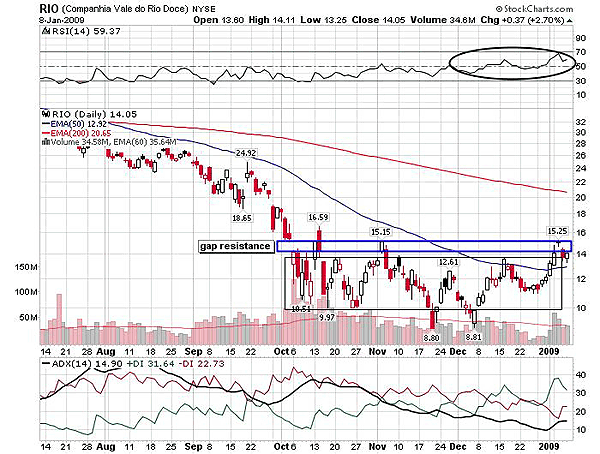
| Companhia Vale do Rio Doce's (RIO) gapdown resistance suppressed the pullback rally in a bear market. The price failed to violate the gap resistance more than twice and as a result the stock consolidated in the 15-20 range. According to Figure 1, the stock has been consolidating for almost four months. Although the rally that began from 8.81 successfully broke through the 50-day moving average (MA) resistance, it failed to violate the (gap) resistance at 15. Currently, RIO is consolidating sideways with the newly formed support of the 50-day MA. |
| In Figure 1, the relative strength index (RSI) (14) was stuck in the 30-50 range, indicating a lack of strength to start the rally. Due to this weakness, the stock plunged 20 points from the higher levels of 32. In lat December, the momentum indicator converted the resistances at 50 levels to support. The bullish breakout of the relative strength index (RSI) (14) encouraged the price rally from 8.81 with the target of upper range at 15. Although the RSI (14) indicated bullish strength, the weak trend might have held back the breakout. The positive directional index (+DI) and negative directional index (-DI) of the average directional index (ADX) (14) are moving with equal pace, indicating consolidation with the support of the 50-day MA (see Figure 1). |

|
| FIGURE 1: RIO, DAILY. The RSI was stuck in the range of the 30–50 levels, indicating a lack of strength to start the rally. |
| Graphic provided by: StockCharts.com. |
| |
| Thus, the consolidation in the 15-20 range is likely to continue until the robust trend is developed. The consolidation process may construct a strong bottom and prevent further decline. The bottom formation is a bullish reversal signal. The upside breakout would lead the stock to the previous resistance. Since the consolidation range is wide, we can grab the trading opportunities. If the RSI (14) slips below the golden support at 50, traders can go short with the potential target of the lower range. Similarly, long positions can be initiated in the reverse direction with the support of 8.81. Considering the possibility of high volatility during the bottom formation, the volume during such trading strategies has to be low. |

|
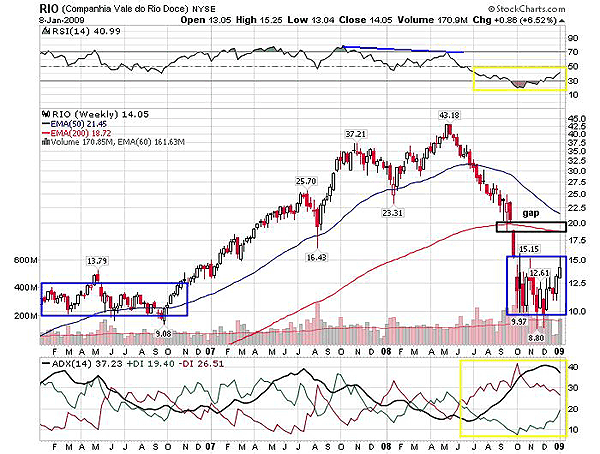
| FIGURE 2: RIO, WEEKLY. In 2006, RIO formed a strong bottom by consolidating in the range of 10–12.5. |
| Graphic provided by: StockCharts.com. |
| |
| In 2006, RIO formed a strong bottom by consolidating in the 10-12.5 range. After the breakout at 12.5, the stock began a fresh upward journey forming new highs (see Figure 2). The 50-day MA offered healthy support to every correction during the rally. Thus, RIO entered a fresh uptrend in late 2006. The RSI (14) showed negative divergence as the stock hit the new high at 43. The ADX (14) reached 40, indicating overheated uptrend. On these bearish notes, RIO turned reluctant to move higher. Gradually, the stock violated all its major MA supports and plunged to 2006 lows. In Figure 2, the stock has established the strong support at its 2006 low. The consolidation at these levels could form a bottom and avoid further decline. |
| The stock remained range-bound when the market conditions in 2008 were worst. This signifies RIO's strength to weather the storm. The ADX (14) shows declining downtrend, and the increasing buying pressure indicated by +DI may give birth to a new uptrend. The RSI (14) has marginally moved above an overbought area. Currently, the technical chart is not completely bullish to initiate the fresh rally, so the stock could consolidate and bottom out. The bottom formation usually is a long process and we cannot predict the consolidation period. There are two gap down resistances in Figure 2, so the traders and investors are requested to wait for a confirmed breakout. |
Active trader in the Indian stock markets since 2003 and a full-time writer. Trading is largely based upon technical analysis.
| Company: | Independent |
| Address: | C1/3 Parth Indraprasth Towers. Vastrapur |
| Ahmedabad, Guj 380015 | |
| E-mail address: | chaitalimohile@yahoo.co.in |
Traders' Resource Links | |
| Independent has not added any product or service information to TRADERS' RESOURCE. | |
Click here for more information about our publications!
Comments
Date: 01/13/09Rank: 3Comment:

Request Information From Our Sponsors
- VectorVest, Inc.
- Executive Premier Workshop
- One-Day Options Course
- OptionsPro
- Retirement Income Workshop
- Sure-Fire Trading Systems (VectorVest, Inc.)
- Trading as a Business Workshop
- VectorVest 7 EOD
- VectorVest 7 RealTime/IntraDay
- VectorVest AutoTester
- VectorVest Educational Services
- VectorVest OnLine
- VectorVest Options Analyzer
- VectorVest ProGraphics v6.0
- VectorVest ProTrader 7
- VectorVest RealTime Derby Tool
- VectorVest Simulator
- VectorVest Variator
- VectorVest Watchdog
- StockCharts.com, Inc.
- Candle Patterns
- Candlestick Charting Explained
- Intermarket Technical Analysis
- John Murphy on Chart Analysis
- John Murphy's Chart Pattern Recognition
- John Murphy's Market Message
- MurphyExplainsMarketAnalysis-Intermarket Analysis
- MurphyExplainsMarketAnalysis-Visual Analysis
- StockCharts.com
- Technical Analysis of the Financial Markets
- The Visual Investor
