HOT TOPICS LIST
- MACD
- Fibonacci
- RSI
- Gann
- ADXR
- Stochastics
- Volume
- Triangles
- Futures
- Cycles
- Volatility
- ZIGZAG
- MESA
- Retracement
- Aroon
INDICATORS LIST
LIST OF TOPICS
PRINT THIS ARTICLE
by James Kupfer
Is the rally in the Dow Jones 30 done for? Analysis of multiple indicators would indicate that it likely is.
Position: Sell
James Kupfer
Mr. Kupfer is a market professional and amateur stock market commentator. Disclosure: It is likely that Mr. Kupfer has or will enter a position in any security he writes about.
PRINT THIS ARTICLE
FIBONACCI
Dow Jones 30 Rally Done?
01/09/09 09:04:12 AMby James Kupfer
Is the rally in the Dow Jones 30 done for? Analysis of multiple indicators would indicate that it likely is.
Position: Sell
| On December 17, 2008, I wrote regarding the Dow Jones 30 that "the first [resistance] level ... is between 9042 and 9136, calculated using a 38% and 23% [Fibonacci] retracement from the August 2008 and October 2007 highs." Admittedly, I did think at the time that the market would surpass those levels, but I do not think that anymore. |
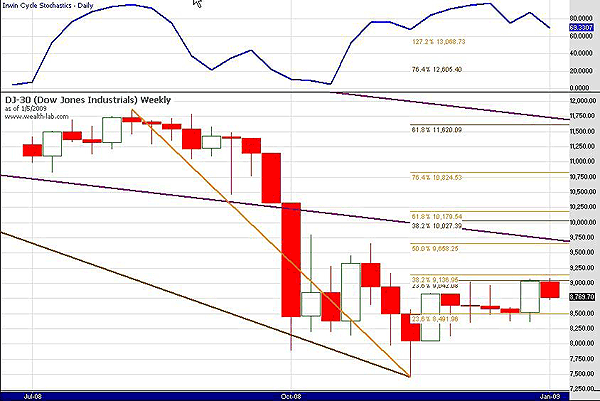
| On January 6, 2009, the DJ 30 peaked at 9088, right in between the resistance levels previously mentioned. In addition to the Fibonacci resistance levels, stochastics on both the daily and weekly periods were sharply overbought prior to the move down on January 7. Daily stochastics were at 98, while the weeklies were at 88. And as can be seen in Figure 1, the weekly stochastics had already started to turn down, signaling underlying weakness in the market. All of these reasons suggest that the DJ 30 has made at least a short-term top. |

|
| FIGURE 1: DJIA, WEEKLY. Stochastics are rolling over, suggesting a top in the market. |
| Graphic provided by: Wealth-lab. |
| |
| In addition, Figure 1 also shows that the Dow Jones 30 has stayed within a narrow band for the last six weeks. This band is, perhaps not so coincidentally, between the 23.6% and 38.2% Fibonacci retracement levels. While this could be base building before a breakout, it is more likely that the inability of the market to move any higher during this period will precede another leg down in the market that will eventually take us to fresh lows. |
Mr. Kupfer is a market professional and amateur stock market commentator. Disclosure: It is likely that Mr. Kupfer has or will enter a position in any security he writes about.
Click here for more information about our publications!
Comments
Date: 01/12/09Rank: 2Comment:
Date: 01/13/09Rank: Comment: My bet is that we have seen the lows and that even though the market trend is down, we will not set a new low. See Koos analysis
Dick Slayton

Request Information From Our Sponsors
- StockCharts.com, Inc.
- Candle Patterns
- Candlestick Charting Explained
- Intermarket Technical Analysis
- John Murphy on Chart Analysis
- John Murphy's Chart Pattern Recognition
- John Murphy's Market Message
- MurphyExplainsMarketAnalysis-Intermarket Analysis
- MurphyExplainsMarketAnalysis-Visual Analysis
- StockCharts.com
- Technical Analysis of the Financial Markets
- The Visual Investor
- VectorVest, Inc.
- Executive Premier Workshop
- One-Day Options Course
- OptionsPro
- Retirement Income Workshop
- Sure-Fire Trading Systems (VectorVest, Inc.)
- Trading as a Business Workshop
- VectorVest 7 EOD
- VectorVest 7 RealTime/IntraDay
- VectorVest AutoTester
- VectorVest Educational Services
- VectorVest OnLine
- VectorVest Options Analyzer
- VectorVest ProGraphics v6.0
- VectorVest ProTrader 7
- VectorVest RealTime Derby Tool
- VectorVest Simulator
- VectorVest Variator
- VectorVest Watchdog
