HOT TOPICS LIST
- MACD
- Fibonacci
- RSI
- Gann
- ADXR
- Stochastics
- Volume
- Triangles
- Futures
- Cycles
- Volatility
- ZIGZAG
- MESA
- Retracement
- Aroon
INDICATORS LIST
LIST OF TOPICS
PRINT THIS ARTICLE
by Alan R. Northam
Normally, the US dollar and gold move in opposite directions. However, in recent days they moved in the same direction. Is this a sign that the dollar and gold are decoupling, or is this just an anomaly?
Position: N/A
Alan R. Northam
Alan Northam lives in the Dallas, Texas area and as an electronic engineer gave him an analytical mind from which he has developed a thorough knowledge of stock market technical analysis. His abilities to analyze the future direction of the stock market has allowed him to successfully trade of his own portfolio over the last 30 years. Mr. Northam is now retired and trading the stock market full time. You can reach him at inquiry@tradersclassroom.com or by visiting his website at http://www.tradersclassroom.com. You can also follow him on Twitter @TradersClassrm.
PRINT THIS ARTICLE
ELLIOTT WAVE
Is The Dollar And Gold Decoupling?
01/09/09 08:58:44 AMby Alan R. Northam
Normally, the US dollar and gold move in opposite directions. However, in recent days they moved in the same direction. Is this a sign that the dollar and gold are decoupling, or is this just an anomaly?
Position: N/A
| The dollar and gold normally move in opposite directions, but in recent days both the dollar and gold have fallen. This has led to some confusion among analysts, and they rationalize the event by saying that it appears that the dollar and gold may be uncoupling, or that these two markets appear to be forming a divergence. However, among Elliotticians this phenomenon is not confusing at all. I don't claim to be such an Elliottician, but I do like to use the Elliott waves in my technical analysis of the markets. Therefore, I present my technical analysis of these two markets. |
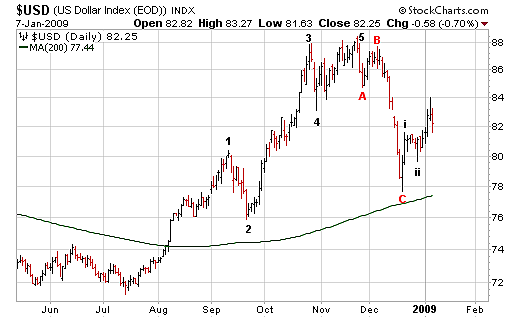
| Figure 1 shows the daily price chart of the US Dollar Index. As can be seen, the dollar has moved upward from July in five nonoverlapping waves. These waves are impulsive and Elliott wave theory says that impulse waves define the direction of the next larger trend. Simply stated, the direction of the major trend is upward. This is verified by the 200-day moving average. When the dollar is trading above the 200-day moving average and the 200-day moving average is moving higher, the long-term trend is known to be in the upward direction. However, since late November the dollar has been trading down. According to Elliott wave theory, an impulse five-wave move is followed by a three-wave counter move. From November 2008, the dollar has fallen in a three-wave countermove labeled waves A, B, and C. Once the countertrend move is complete, the major trend resumes and this is what the dollar is doing. Since mid-December, the dollar has started to resume its upward trend and has traced its first two waves out of the first five-wave impulse. Note also that the fall in the dollar was stopped in mid-December by the 200-day moving average acting as support. Thus, the long-term direction of the dollar is upward. |

|
| FIGURE 1: US DOLLAR, DAILY. Daily price chart of the US Dollar Index shows the Elliott wave count and 200-day simple moving average. |
| Graphic provided by: StockCharts.com. |
| |
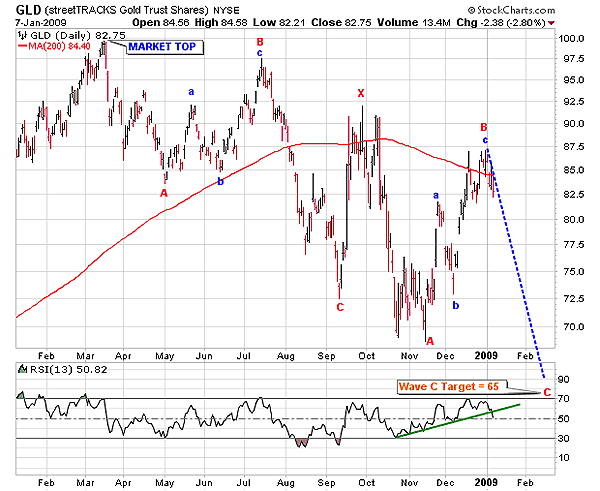
| Figure 2 is the daily price chart of gold. As can be seen, gold made a major bull market top in March 2008. Since then, gold has been in a countertrend correction. Elliott wave theory states that following an impulse upward move, the market will correct itself in a three-wave corrective move. However, the theory also states that these market corrections can become more complex. This is the case with gold. Instead of a simple three-wave ABC countertrend correction, gold looks to be forming a double ABC countertrend corrective wave pattern. As can be seen, there are two ABC wave patterns connected together by an X wave. The second ABC wave pattern is still incomplete. Waves A and B look to be complete, but not wave C. In addition, with the beginning of 2009 it looks like wave C down is now starting to unfold. From Elliott wave theory I have shown the expected target price for the completion of wave C to be $65 for GLD. Further, note that GLD is trading below its 200-day moving average and the 200-day moving average is pointing downward. This is confirmation that the long-term trend is down for gold. |

|
| FIGURE 2: GLD, DAILY. Daily price chart of the StreetTracks Gold Trust Shares. This chart shows the Elliott wave count and 200-day simple moving average. |
| Graphic provided by: StockCharts.com. |
| |
| Further analysis indicates that no trend, whether up or down, moves in a straight line. All trends have days in which the market moves upward and days in which the market moves downward. What distinguishes an uptrend from a downtrend is that in an uptrend there are many more days in which the market moves upward than downward, and in a downtrend, just the opposite occurs. |
| In conclusion, when we analyze the dollar and gold using Elliott wave theory and moving averages, we can see that the US dollar is still in a long-term upward trend, whereas gold is still in a long-term downward trend. As for what happened with gold and the US dollar, perhaps the dollar simply had a down day, whereas perhaps the gold market traded in the direction of its trend. The US dollar and gold are not uncoupling or showing a divergence. They are simply doing what they are suppose to be doing, and that is moving in opposite directions over the longer term. |
Alan Northam lives in the Dallas, Texas area and as an electronic engineer gave him an analytical mind from which he has developed a thorough knowledge of stock market technical analysis. His abilities to analyze the future direction of the stock market has allowed him to successfully trade of his own portfolio over the last 30 years. Mr. Northam is now retired and trading the stock market full time. You can reach him at inquiry@tradersclassroom.com or by visiting his website at http://www.tradersclassroom.com. You can also follow him on Twitter @TradersClassrm.
| Garland, Tx | |
| Website: | www.tradersclassroom.com |
| E-mail address: | inquiry@tradersclassroom.com |
Click here for more information about our publications!
Comments
Date: 01/12/09Rank: 5Comment:

|

Request Information From Our Sponsors
- StockCharts.com, Inc.
- Candle Patterns
- Candlestick Charting Explained
- Intermarket Technical Analysis
- John Murphy on Chart Analysis
- John Murphy's Chart Pattern Recognition
- John Murphy's Market Message
- MurphyExplainsMarketAnalysis-Intermarket Analysis
- MurphyExplainsMarketAnalysis-Visual Analysis
- StockCharts.com
- Technical Analysis of the Financial Markets
- The Visual Investor
- VectorVest, Inc.
- Executive Premier Workshop
- One-Day Options Course
- OptionsPro
- Retirement Income Workshop
- Sure-Fire Trading Systems (VectorVest, Inc.)
- Trading as a Business Workshop
- VectorVest 7 EOD
- VectorVest 7 RealTime/IntraDay
- VectorVest AutoTester
- VectorVest Educational Services
- VectorVest OnLine
- VectorVest Options Analyzer
- VectorVest ProGraphics v6.0
- VectorVest ProTrader 7
- VectorVest RealTime Derby Tool
- VectorVest Simulator
- VectorVest Variator
- VectorVest Watchdog
