HOT TOPICS LIST
- MACD
- Fibonacci
- RSI
- Gann
- ADXR
- Stochastics
- Volume
- Triangles
- Futures
- Cycles
- Volatility
- ZIGZAG
- MESA
- Retracement
- Aroon
INDICATORS LIST
LIST OF TOPICS
PRINT THIS ARTICLE
by Donald W. Pendergast, Jr.
Having gained as much as 29% since making a major low in November 2008, the New York Composite Index now resides near its 50-day exponential moving average. Is another downleg due, or is this just a pause before running even higher?
Position: Hold
Donald W. Pendergast, Jr.
Donald W. Pendergast is a financial markets consultant who offers specialized services to stock brokers and high net worth individuals who seek a better bottom line for their portfolios.
PRINT THIS ARTICLE
KELTNER CHANNELS
NY Composite Technicals, Breadth Still Positive For 2009 Rally
01/09/09 08:25:13 AMby Donald W. Pendergast, Jr.
Having gained as much as 29% since making a major low in November 2008, the New York Composite Index now resides near its 50-day exponential moving average. Is another downleg due, or is this just a pause before running even higher?
Position: Hold
| Investor/trader sentiment can change so quickly. Seven weeks ago, it seemed that all the financial news outlets were abuzz with predictions of doom, gloom, and austerity in the new Hooverville. Funny how a nearly 30% gain in the broad US indexes has changed their tune. Now, many of the top analysts are recommending that investors prepare shopping lists of beaten-down blue-chip stocks that were bludgeoned by the merciless market. So who's right, anyway? Are the permabears going to be proven right regarding their deflationary, stock market collapse scenario, or are the value investors of the world about to make some of the easiest money of their investing careers? Our first stop is the weekly chart of the NYA, as we attempt to find out. |

|
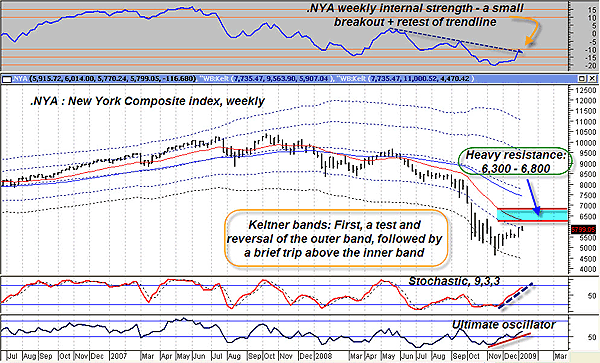
| FIGURE 1: NEW YORK COMPOSITE INDEX, WEEKLY. If the index can muster enough strength to keep its internal strength readings above the down channel line (top pane), a trip toward 6,300 may be in the cards. |
| Graphic provided by: MetaStock. |
| |
| While it wouldn't be surprising to see a bit of turbulence (like we saw on January 7, 2009) after such a major advance from the lows, several indicators seem to imply that the NYA still may have some room to run before a corrective phase kicks in. First off, in Figure 1, the weekly internal strength indicator (top pane, made up of a weighted measurement of new highs/new lows, the advance-decline line, up/down volume, and a few other calculations combined into one indicator) just completed a successful breakout above its down channel line and is now retesting the channel. The trend of the internal strength indicator is also bullish as long as the red up trendline holds. Moving down onto the main chart, the Keltner band behavior is encouraging; after moving smartly away from the outer band, price actually briefly extended beyond the top of the inner band. That's more significant than usual, because the weekly stochastic is maintaining a very strong trajectory higher, one that implies a run toward the top of its range — if its trendline holds, that is. Finally, the ultimate oscillator also lends a bullish continuation aura to this chart. It, too, is solidly above its trendline and also appears to have some room to run. Bottom line: If the internal strength breakout can stay at or above the down channel line, I expect a move (after a minor pullback) in the NYA up to at least 6,300, which is the first major resistance hurdle. More significant resistance lies near 6,800, which is the 38.2% Fibonacci retracement of the entire bear market selloff. An examination of the NYA daily chart is our final stop. |

|
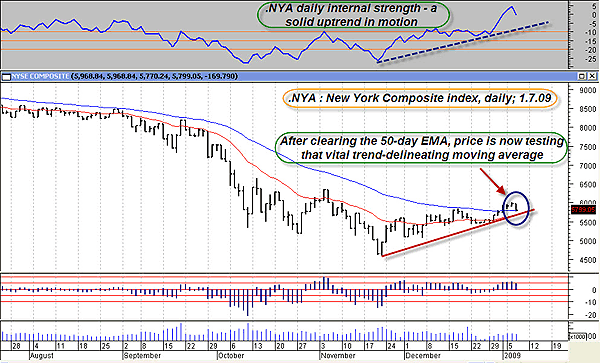
| FIGURE 2: NEW YORK COMPOSITE INDEX, DAILY. After shoveling its way through two months worth of bear market debris, the New York Composite Index finally closes above its 50-week EMA. A very strong internal strength trend (top pane) lends credibility to the ongoing bullish scenario. |
| Graphic provided by: MetaStock. |
| Graphic provided by: WB EOD Detrend from Profit Trader for MetaStock. |
| |
| The most striking aspect of this daily graph seen in Figure 2 is the mammoth uptrend in the internal strength indicator. It's extended from the long-term trendline, but the series of higher highs and higher lows combined with the fact that it recently exceeded its zero line (for the first time since June 2008) should be a warning to the permabears that this uptrend still has a great deal of pressure propelling it higher. On the main chart, note that price decisively closed above the 50-day exponential moving average (EMA), pulling back slightly on a retest of that important trend-delineating average. The red long-term up trendline is also intact, another bullish confirmation. The action over the next few sessions should clear up any confusion about the direction of the NYA, whether it's a trip up into the strong overhead resistance zone or another sharp selloff back into bear territory. |
| There is another force driving this market higher, something most market technicians seem to be unfamiliar with, and that is the six-year Kress cycle. Suffice it to say that the last time the six-year Kress cycle bottomed, the ultimate low was in place for the 2000–03 bear market. If the cycle is on track to repeat its performance of October 2002, we may well see a very strong rally that lasts until late spring–early summer 2009, before another (hopefully less vicious) broad market selloff ensues, one that will attempt a final test of the November 2008 low. Time will tell. |
Donald W. Pendergast is a financial markets consultant who offers specialized services to stock brokers and high net worth individuals who seek a better bottom line for their portfolios.
| Title: | Writer, market consultant |
| Company: | Linear Trading Systems LLC |
| Jacksonville, FL 32217 | |
| Phone # for sales: | 904-239-9564 |
| E-mail address: | lineartradingsys@gmail.com |
Traders' Resource Links | |
| Linear Trading Systems LLC has not added any product or service information to TRADERS' RESOURCE. | |
Click here for more information about our publications!
PRINT THIS ARTICLE

|

Request Information From Our Sponsors
- StockCharts.com, Inc.
- Candle Patterns
- Candlestick Charting Explained
- Intermarket Technical Analysis
- John Murphy on Chart Analysis
- John Murphy's Chart Pattern Recognition
- John Murphy's Market Message
- MurphyExplainsMarketAnalysis-Intermarket Analysis
- MurphyExplainsMarketAnalysis-Visual Analysis
- StockCharts.com
- Technical Analysis of the Financial Markets
- The Visual Investor
- VectorVest, Inc.
- Executive Premier Workshop
- One-Day Options Course
- OptionsPro
- Retirement Income Workshop
- Sure-Fire Trading Systems (VectorVest, Inc.)
- Trading as a Business Workshop
- VectorVest 7 EOD
- VectorVest 7 RealTime/IntraDay
- VectorVest AutoTester
- VectorVest Educational Services
- VectorVest OnLine
- VectorVest Options Analyzer
- VectorVest ProGraphics v6.0
- VectorVest ProTrader 7
- VectorVest RealTime Derby Tool
- VectorVest Simulator
- VectorVest Variator
- VectorVest Watchdog
