

HOT TOPICS LIST
- MACD
- Fibonacci
- RSI
- Gann
- ADXR
- Stochastics
- Volume
- Triangles
- Futures
- Cycles
- Volatility
- ZIGZAG
- MESA
- Retracement
- Aroon
INDICATORS LIST
LIST OF TOPICS
PRINT THIS ARTICLE
by Chaitali Mohile
CDNX Composite consolidated after the steep fall, forming a descending triangle. The pattern breakout was a major reversal indication.
Position: Hold
Chaitali Mohile
Active trader in the Indian stock markets since 2003 and a full-time writer. Trading is largely based upon technical analysis.
PRINT THIS ARTICLE
REVERSAL
CDNX Composite Index Trend Reversed
01/08/09 01:50:57 PMby Chaitali Mohile
CDNX Composite consolidated after the steep fall, forming a descending triangle. The pattern breakout was a major reversal indication.
Position: Hold
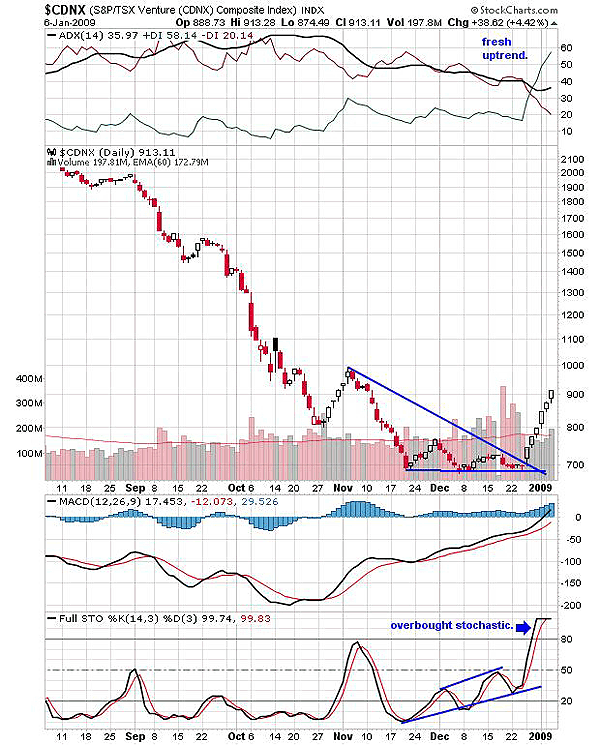
| S&P/TSX Venture (CDNX) Composite Index formed a descending triangle in the existing downtrend. The pattern in Figure 1 has an upside breakout, forming a major trend reversal signal. We can see the average directional movement index (ADX) (14) that was ruled by the bears suddenly lose hold. The selling pressure indicated by negative directional index (-DI) witnessed a steep fall, with the bullish breakout of the descending triangle pattern. The pattern is a bearish continuation formation of the current downtrend and undergoes a bearish breakout. The reversal breakout is well supported by healthy volume. The index has already rallied 200 points from the breakout level at 700. The average directional movement index ADX (14) at 35 indicates a well-developed uptrend with a strong buying pressure. |
|
| FIGURE 1: $CDNX, DAILY. The reversal breakout is rallying toward the first resistance at 1000 levels. |
| Graphic provided by: StockCharts.com. |
| |
| The moving average convergence/divergence (MACD) (12,26,9) is positive and ready to surge in positive territory. The full stochastic (14,3,3) is moving flat in the overbought areas, indicating the stability of a current bullish rally. Since $CDNX has run much higher, recommending a fresh long position has its risks. The resistance at 1000 is the nearest target for the rally. The size of bullish candles indicate the consistency in the rally, stable and safe buying from the smart traders. The traders on board can hold their long positions with the target of a resistance level of 1000. |
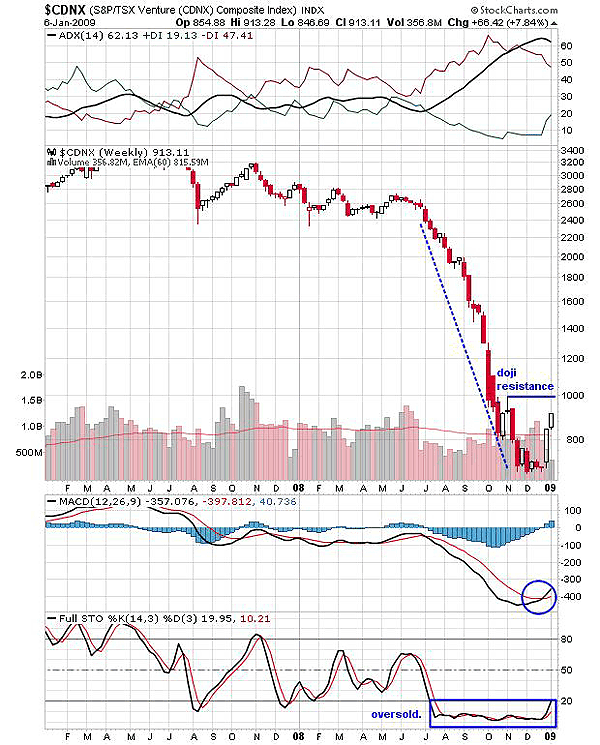
| Though a short-term uptrend has come up roaring, the main trend remains down. The long-term bear market will sustain until a strong bottom is formed, so we cannot trade anticipating the breakout above the 1000 level. See Figure 2. |
|
| FIGURE 2: $CDNX, WEEKLY. The oversold stochastic (14,3,3) suggests encouraging rallying in the near future. The declining ADX (14) indicates a weak downtrend. |
| Graphic provided by: StockCharts.com. |
| |
| The downtrend indicated by the ADX (14) is highly overheated at 63 levels. The declining ADX (14) would weaken the downtrend but may not end the bears completely. The situation is favorable for the bulls waiting for the right opportunity. The moving average convergence/divergence (MACD) (12,26,9) has a bullish crossover, and the MACD histogram has already shifted to positive territory. The stochastic (14,3,3) is oversold since July 2008. During the flat movement in the oversold area, the price corrected more than 50% of the value. Currently, the oscillator is ready to move above the 20 levels, indicating a bullish rally ahead. Although the oscillator is suggesting a good entry point above 20, we cannot go for a fresh trade as $CDNX has moved closer to the resistance at the 1000 level. The doji candlestick pattern in November 2008 made a high at 1000, which stands as a strong resistance for the current rally. |
| Thus, the reversal breakout of a descending triangle pattern has changed the downtrend. The short-term uptrend will encourage the rally in future trading. |
Active trader in the Indian stock markets since 2003 and a full-time writer. Trading is largely based upon technical analysis.
| Company: | Independent |
| Address: | C1/3 Parth Indraprasth Towers. Vastrapur |
| Ahmedabad, Guj 380015 | |
| E-mail address: | chaitalimohile@yahoo.co.in |
Traders' Resource Links | |
| Independent has not added any product or service information to TRADERS' RESOURCE. | |
Click here for more information about our publications!
Comments

Request Information From Our Sponsors
- StockCharts.com, Inc.
- Candle Patterns
- Candlestick Charting Explained
- Intermarket Technical Analysis
- John Murphy on Chart Analysis
- John Murphy's Chart Pattern Recognition
- John Murphy's Market Message
- MurphyExplainsMarketAnalysis-Intermarket Analysis
- MurphyExplainsMarketAnalysis-Visual Analysis
- StockCharts.com
- Technical Analysis of the Financial Markets
- The Visual Investor
- VectorVest, Inc.
- Executive Premier Workshop
- One-Day Options Course
- OptionsPro
- Retirement Income Workshop
- Sure-Fire Trading Systems (VectorVest, Inc.)
- Trading as a Business Workshop
- VectorVest 7 EOD
- VectorVest 7 RealTime/IntraDay
- VectorVest AutoTester
- VectorVest Educational Services
- VectorVest OnLine
- VectorVest Options Analyzer
- VectorVest ProGraphics v6.0
- VectorVest ProTrader 7
- VectorVest RealTime Derby Tool
- VectorVest Simulator
- VectorVest Variator
- VectorVest Watchdog