HOT TOPICS LIST
- MACD
- Fibonacci
- RSI
- Gann
- ADXR
- Stochastics
- Volume
- Triangles
- Futures
- Cycles
- Volatility
- ZIGZAG
- MESA
- Retracement
- Aroon
INDICATORS LIST
LIST OF TOPICS
PRINT THIS ARTICLE
by Donald W. Pendergast, Jr.
The energy sector has roared back to life over the past two weeks. Here's a look at one of the strongest equity performers from the oil services group.
Position: Accumulate
Donald W. Pendergast, Jr.
Donald W. Pendergast is a financial markets consultant who offers specialized services to stock brokers and high net worth individuals who seek a better bottom line for their portfolios.
PRINT THIS ARTICLE
AROON
Bristow Group Has Highest RS In Oil Services Industry Group
01/08/09 08:26:59 AMby Donald W. Pendergast, Jr.
The energy sector has roared back to life over the past two weeks. Here's a look at one of the strongest equity performers from the oil services group.
Position: Accumulate
| After what seemed like an eternity for energy bulls, the short-covering machine kicked into full swing in late December 2008, driving crude oil, natural gas, and their related equities substantially higher. While it's much too early to declare a resumption of the 1999–2008 energy bull market, the speed with which these markets reversed is enough to make even the most hardened permabear think twice before going short again. One of the strongest areas within the energy complex is the oil services industry group, and we'll take a look at the strongest stock within this group. |

|
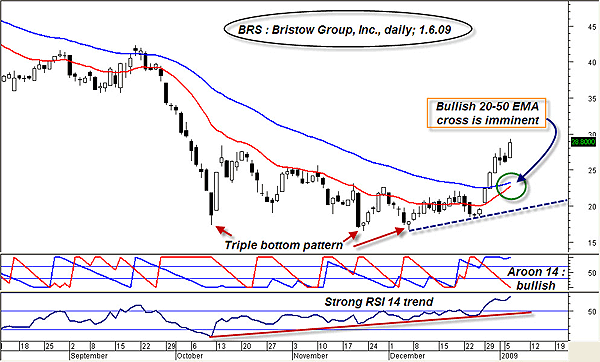
| FIGURE 1: BRS, DAILY. A variety of technicals and patterns confirm the high relative strength status of this oil services industry group component. Waiting for a pullback may offer a lower-risk entry point. |
| Graphic provided by: MetaStock. |
| |
| Bristow Group Inc. (BRS) is a Houston, TX–based firm that provides specialized transportation services to offshore oil and gas exploration drilling rigs, platforms, and other related locations. They operate throughout the Americas, Europe, Africa, and Southeast Asia, utilizing a fleet of 500-plus helicopters. The stock has been on a tear since breaking out of the base it established after bottoming (forming a triple-bottom pattern in the process) at $17.40 in late November. The daily chart (Figure 1) paints an extremely bullish image; a series of higher lows/higher highs has printed, the Aroon 14 indicator (essential for all trend-followers) has assumed an exceedingly bullish posture, and the 20-day exponential moving average (EMA) is close to piercing the 50-day EMA to the upside. The RSI (14) is also confirming the power behind this bullish move. The weekly and monthly charts (not shown) for BRS are also in agreement, having made significant cycle lows during November–December 2008; the Oil Services HOLDRS (OIH) and iShares Dow Jones US Oil Equipment and Services Index Fund (IEZ) also concur that a major low has been made. A glance at a 60-minute chart of BRS (Figure 2) should give us some more insight regarding how to play this strong uptrend in the stock. |

|
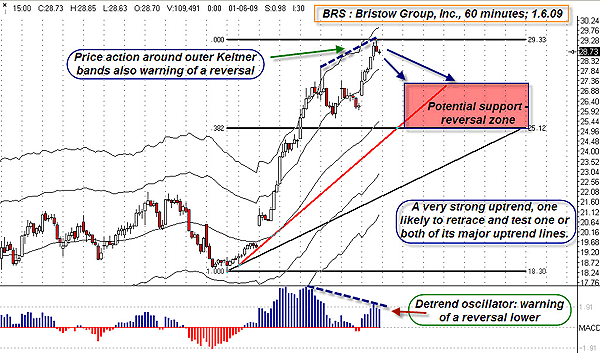
| FIGURE 2: BRS, HOURLY. Both the detrend oscillator and the Keltner bands are warning of a potential trend reversal on the 60-minute time frame. |
| Graphic provided by: Ensign Windows. |
| |
| Focusing on the next significant lower time frame, we see the powerful uptrend in greater detail — and some of those details suggest that BRS is nearing a potential reversal zone on its 60-minute chart. First of all, the very pronounced negative price-momentum divergence on the detrend oscillator (lower pane) is sending a powerful warning of a possible reversal, as is the price action around the outer Keltner bands; note how price was able to penetrate the band on the first high, even as it failed to exceed the band on what is presumed to be the current high. Anyone long BRS on a 60-minute time frame should consider taking some profits and/or trailing a closer stop. If a reversal occurs, it by no means signifies an end to BRS's powerful uptrend; it just means that the trend needs a brief period to consolidate its recent gains before (presumably) heading to even higher price levels. If price pulls back now, the confluence zone (red shaded box) that contains both up trendlines and the 38.2% Fibonacci retracement is the most likely area for the pullback to terminate. A drop below the 38.2% Fib retracement toward the 50% Fib retracement would likely mean a more complex A-B-C correction would develop. Of course, anything is possible in the stock market, but the bulk of the technical evidence suggests that BRS is due for a pullback of some degree before it will be able to resume its current uptrend. |
| Some trade setups are low risk, while some are not. Right now, going long BRS is not low risk, but waiting for a pullback on its 60-minute chart offers significantly lower risk. Should that pullback materialize, wise traders will confirm that OIH, IEZ, and the NYA are all in agreement regarding the potential for further bullish price action. |
Donald W. Pendergast is a financial markets consultant who offers specialized services to stock brokers and high net worth individuals who seek a better bottom line for their portfolios.
| Title: | Writer, market consultant |
| Company: | Linear Trading Systems LLC |
| Jacksonville, FL 32217 | |
| Phone # for sales: | 904-239-9564 |
| E-mail address: | lineartradingsys@gmail.com |
Traders' Resource Links | |
| Linear Trading Systems LLC has not added any product or service information to TRADERS' RESOURCE. | |
Click here for more information about our publications!
PRINT THIS ARTICLE

Request Information From Our Sponsors
- StockCharts.com, Inc.
- Candle Patterns
- Candlestick Charting Explained
- Intermarket Technical Analysis
- John Murphy on Chart Analysis
- John Murphy's Chart Pattern Recognition
- John Murphy's Market Message
- MurphyExplainsMarketAnalysis-Intermarket Analysis
- MurphyExplainsMarketAnalysis-Visual Analysis
- StockCharts.com
- Technical Analysis of the Financial Markets
- The Visual Investor
- VectorVest, Inc.
- Executive Premier Workshop
- One-Day Options Course
- OptionsPro
- Retirement Income Workshop
- Sure-Fire Trading Systems (VectorVest, Inc.)
- Trading as a Business Workshop
- VectorVest 7 EOD
- VectorVest 7 RealTime/IntraDay
- VectorVest AutoTester
- VectorVest Educational Services
- VectorVest OnLine
- VectorVest Options Analyzer
- VectorVest ProGraphics v6.0
- VectorVest ProTrader 7
- VectorVest RealTime Derby Tool
- VectorVest Simulator
- VectorVest Variator
- VectorVest Watchdog
