HOT TOPICS LIST
- MACD
- Fibonacci
- RSI
- Gann
- ADXR
- Stochastics
- Volume
- Triangles
- Futures
- Cycles
- Volatility
- ZIGZAG
- MESA
- Retracement
- Aroon
INDICATORS LIST
LIST OF TOPICS
PRINT THIS ARTICLE
by James Kupfer
Is gold putting in an intermediate top?
Position: Sell
James Kupfer
Mr. Kupfer is a market professional and amateur stock market commentator. Disclosure: It is likely that Mr. Kupfer has or will enter a position in any security he writes about.
PRINT THIS ARTICLE
STOCHASTIC OSCILL
Gold Turning Over
01/08/09 02:40:47 PMby James Kupfer
Is gold putting in an intermediate top?
Position: Sell
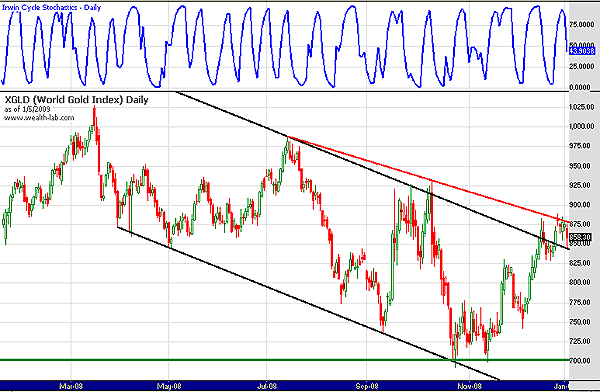
| Gold's price movements have done a great job of staying within the metal's intermediate-term trend channels shown in black in Figure 1. On December 23, seeing that gold was nearing the top of the channel, I stated, "Gold could well have a bit more shine left, but a top of intermediate proportions is likely near." Given the subsequent price action of gold, I think it is likely that the top has now been made. |

|
| FIGURE 1: XGLD, DAILY. Gold is still in a downward-sloping channel. |
| Graphic provided by: Wealth-lab. |
| |
| First off, gold stayed below the trendline drawn (in red) between the two previous major peaks. For two days, prices did cross above the trendline, but they failed to break through. Moreover, price has now dropped a good bit below the trendline. See Figure 2. |

|
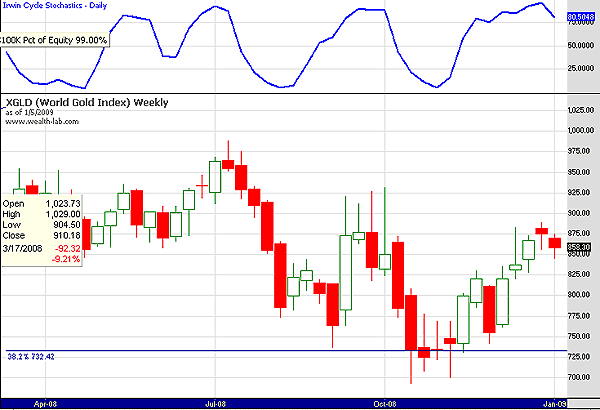
| FIGURE 2: XGLD, WEEKLY. Weekly stochastics is starting to roll over. |
| Graphic provided by: Wealth-lab. |
| |
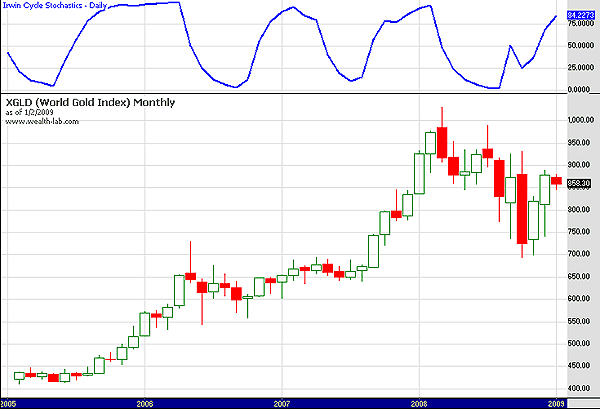
| In addition to the reasons stated in my December 23rd missive, stochastics for the daily and weekly time frames have both turned down. The daily stochastic turned down from a very overbought level, as did the weekly. The monthly stochastics, although still rising, are now overbought. This turning down is indicative that prices have reached their zenith. See Figure 3. |

|
| FIGURE 3: XGLD, MONTHLY. Monthly stochastics is overbought, but still moving up. |
| Graphic provided by: Wealth-lab. |
| |
| In a perfect world, gold would have stayed within the boundaries of the original channel. Some people might interpret this break as a buying opportunity, but I think given all the evidence it will prove to be a final burst of energy that will soon be undone. Should it occur, a move down would most likely take gold below $700. |
Mr. Kupfer is a market professional and amateur stock market commentator. Disclosure: It is likely that Mr. Kupfer has or will enter a position in any security he writes about.
Click here for more information about our publications!
Comments
Date: 01/11/09Rank: 5Comment:
Date: 01/12/09Rank: 5Comment:

Request Information From Our Sponsors
- StockCharts.com, Inc.
- Candle Patterns
- Candlestick Charting Explained
- Intermarket Technical Analysis
- John Murphy on Chart Analysis
- John Murphy's Chart Pattern Recognition
- John Murphy's Market Message
- MurphyExplainsMarketAnalysis-Intermarket Analysis
- MurphyExplainsMarketAnalysis-Visual Analysis
- StockCharts.com
- Technical Analysis of the Financial Markets
- The Visual Investor
- VectorVest, Inc.
- Executive Premier Workshop
- One-Day Options Course
- OptionsPro
- Retirement Income Workshop
- Sure-Fire Trading Systems (VectorVest, Inc.)
- Trading as a Business Workshop
- VectorVest 7 EOD
- VectorVest 7 RealTime/IntraDay
- VectorVest AutoTester
- VectorVest Educational Services
- VectorVest OnLine
- VectorVest Options Analyzer
- VectorVest ProGraphics v6.0
- VectorVest ProTrader 7
- VectorVest RealTime Derby Tool
- VectorVest Simulator
- VectorVest Variator
- VectorVest Watchdog
