HOT TOPICS LIST
- MACD
- Fibonacci
- RSI
- Gann
- ADXR
- Stochastics
- Volume
- Triangles
- Futures
- Cycles
- Volatility
- ZIGZAG
- MESA
- Retracement
- Aroon
INDICATORS LIST
LIST OF TOPICS
PRINT THIS ARTICLE
by Paolo Pezzutti
Apple Inc. is a stock to watch with news about Steve Jobs' health.
Position: N/A
Paolo Pezzutti
Author of the book "Trading the US Markets - A Comprehensive Guide to US Markets for International Traders and Investors" - Harriman House (July 2008)
PRINT THIS ARTICLE
TECHNICAL ANALYSIS
Apple Stock Pushed Higher With News Of Steve Jobs' Health
01/08/09 01:43:03 PMby Paolo Pezzutti
Apple Inc. is a stock to watch with news about Steve Jobs' health.
Position: N/A
| New about Steve Jobs' health pushed Apple Inc. (AAPL) higher. Jobs said he is suffering from a nutritional ailment and that he planned to remain Apple's chief executive officer during his treatment. He said that he will be the first one to step up and tell the board of directors if he can no longer fulfill his duties as Apple's CEO. Of course, Apple has a succession plan in place if Jobs can no longer run the company. The plan has existed for several years. Although the news pushed the stock higher, some analysts still have some concerns. Apple will report earnings later this month for its fiscal first quarter, which ended in December, but recently, Argus Research lowered the price target to $145 from $155 to reflect reduced earnings estimates. Argus expected earnings to decline on a year-over-year basis (fourth-quarter estimates to $1.52/$9.7 billion from $1.54/$10.1 billion vs $1.40/$9.9 billion consensus). Argus reported that overall, Apple remained in a very good position. |

|
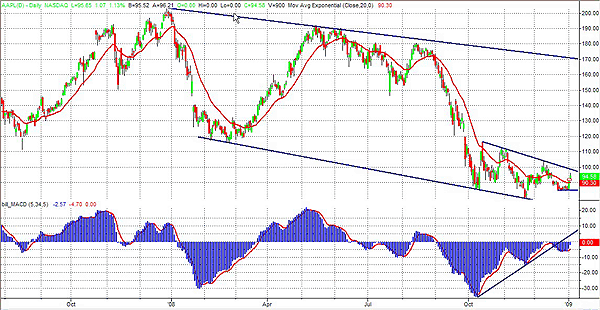
| FIGURE 1: AAPL, DAILY. Prices are moving within a wide descending channel. |
| Graphic provided by: TradeStation. |
| |
| In the daily chart in Figure 1, you can see that the stock is moving within a wide descending channel started at the beginning of 2008. Apple is now developing a long consolidation formation that started last October. The stock has printed a low at $79.14 on November 21. In May 2008, AAPL was trading above the $180 level. During the past two months, shares have decreased their volatility gradually, daily ranges went down from more than 10% back in October to 3-5% in the last week, and prices have built a solid base to develop a consistent rebound from recent lows. |

|
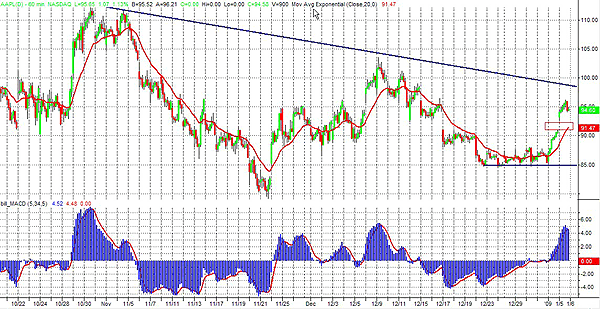
| FIGURE 2: AAPL, HOURLY. $85 is an important support; it was tested five times. |
| Graphic provided by: TradeStation. |
| |
| The moving average convergence/divergence (MACD) printed a positive divergence in coincidence with the November low. Prices are moving within a smaller descending channel since the beginning of October 2008. In the 60-minute chart (Figure 2), you can see that there are many close resistances to the continuation of the rebound. The support at $85 is very important. It was tested five times before the last up leg was started. On Monday, January 5, 2009, the stock closed higher, although the market ended slightly lower, which is a sign of strength. AAPL opened with a gap up setting the support at $91, which represents the closure of the up gap. Prices are approaching the descending trendline. The round number of $100 could be retested, but the longer-term trend is still negative and I do not see elements at the moment for a reversal. |

|
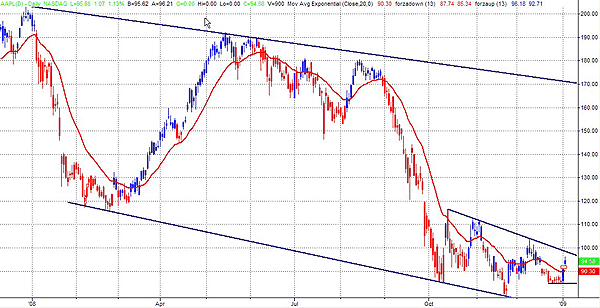
| FIGURE 3: AAPL, DAILY. The force index indicates that a positive move has started. The first resistance level, however, is very close. |
| Graphic provided by: TradeStation. |
| |
| In Figure 3, you can see the force index indicator applied to the chart, which was introduced by trader and author Alexander Elder. It is an indicator oscillator that attempts to measure the force of bulls during uptrends and the force of bears in downtrends. It takes into account price and volume. The rule for its construction is: Force index = Volume * (close - close of the previous day) A 13-day exponential moving average (EMA) of the force index helps to track longer-term changes in the force of the market's participants. When it is positive, it means that bulls are in control. When it becomes negative, it means that the bears have taken control. As with any oscillator, divergences could help identify turning points. In the chart, you can see that the indicator turned positive two sessions ago, indicating the beginning of a positive short-term trend. The up gap printed on Monday can help identify a support and possible stop-loss level in case a long trade is established. |

|
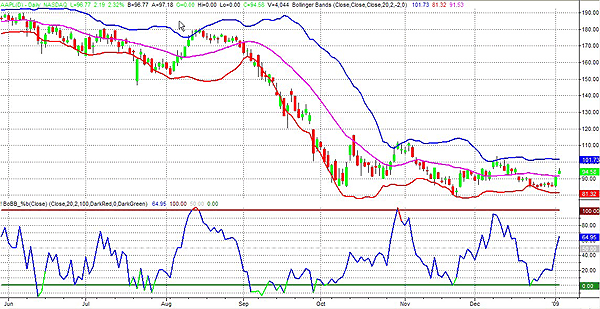
| FIGURE 4: AAPL, DAILY. The Bollinger bands and the %b indicator displays that the stock is in a trading range. The rebound could continue to retest $100. |
| Graphic provided by: TradeStation. |
| |
| In Figure 4, I used the Bollinger bands and the %b indicator. The %b is an indicator derived from the Bollinger bands. It measures where the last price is in relation to the bands. The formula to build this indicator is: (LAST - LOWERBAND)/ (UPPERBAND - LOWERBAND) %b can be used to tell us where we are within the bands. %b can assume negative values and values above 100 when prices are outside of the bands. It is a relative tool with no absolute information. The power of it is that you can calculate it not only on the price (typically the close), but also on other indicators. You can see from the chart that the bands are parallel and horizontal, which means that the stock is moving within a trading range. The %b has moved up from its oversold level, indicating that the rebound is ongoing. The move could continue in the short term to bring the %b into overbought territory and prices to test the upper Bollinger band at $100. |
Author of the book "Trading the US Markets - A Comprehensive Guide to US Markets for International Traders and Investors" - Harriman House (July 2008)
| Address: | VIA ROBERTO AGO 26 POSTAL CODE 00166 |
| Rome, ITALY | |
| Phone # for sales: | +393357540708 |
| E-mail address: | pezzutti.paolo@tiscali.it |
Click here for more information about our publications!
Comments
Date: 01/09/09Rank: 3Comment:

Request Information From Our Sponsors
- StockCharts.com, Inc.
- Candle Patterns
- Candlestick Charting Explained
- Intermarket Technical Analysis
- John Murphy on Chart Analysis
- John Murphy's Chart Pattern Recognition
- John Murphy's Market Message
- MurphyExplainsMarketAnalysis-Intermarket Analysis
- MurphyExplainsMarketAnalysis-Visual Analysis
- StockCharts.com
- Technical Analysis of the Financial Markets
- The Visual Investor
- VectorVest, Inc.
- Executive Premier Workshop
- One-Day Options Course
- OptionsPro
- Retirement Income Workshop
- Sure-Fire Trading Systems (VectorVest, Inc.)
- Trading as a Business Workshop
- VectorVest 7 EOD
- VectorVest 7 RealTime/IntraDay
- VectorVest AutoTester
- VectorVest Educational Services
- VectorVest OnLine
- VectorVest Options Analyzer
- VectorVest ProGraphics v6.0
- VectorVest ProTrader 7
- VectorVest RealTime Derby Tool
- VectorVest Simulator
- VectorVest Variator
- VectorVest Watchdog
