HOT TOPICS LIST
- MACD
- Fibonacci
- RSI
- Gann
- ADXR
- Stochastics
- Volume
- Triangles
- Futures
- Cycles
- Volatility
- ZIGZAG
- MESA
- Retracement
- Aroon
INDICATORS LIST
LIST OF TOPICS
PRINT THIS ARTICLE
by Chaitali Mohile
The Russell 3000 has recovered forming higher lows after establishing a strong support.
Position: N/A
Chaitali Mohile
Active trader in the Indian stock markets since 2003 and a full-time writer. Trading is largely based upon technical analysis.
PRINT THIS ARTICLE
BREAKOUTS
Russell 3000 Ready To Surge
01/07/09 01:09:26 PMby Chaitali Mohile
The Russell 3000 has recovered forming higher lows after establishing a strong support.
Position: N/A
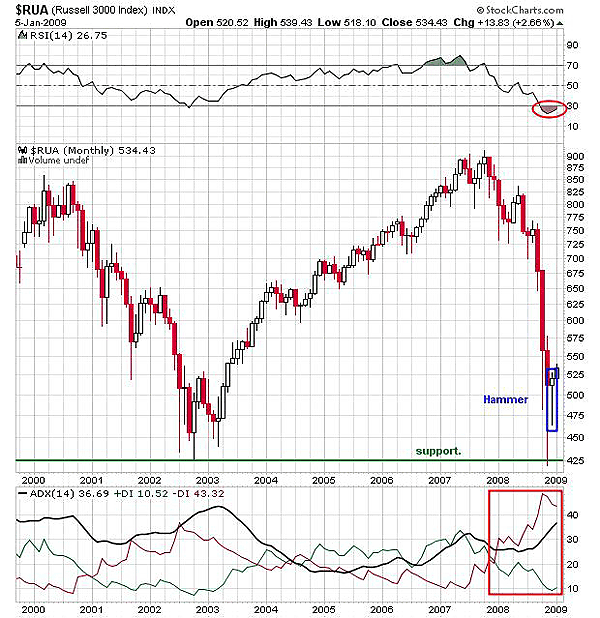
| During the year 2008 most of the indexes, including the Russell 3000 index ($RUA), had moved to 2002 lows. $RUA established a support at 425 levels in November 2008. After the huge decline, the index is looking like it is ready to bounce. In Figure 1, the relative strength index (RSI) (14) is oversold, and the hammer candlestick pattern is formed. As soon as the support was held in November at 425 levels, $RUA recovered 100 points from the low. The hammer formed in December indicated the bullish reversal pattern. However, the long-term downtrend indicated by the average directional movement index (ADX) (14) is likely to sustain. The oversold RSI (14) and the hammer together may drive the rally with positive sentiments. For the robust rally, traders should watch for RSI (14) moving in bullish areas above 30 levels in Figure 1. |

|
| FIGURE 1: $RUA, MONTHLY. The oversold RSI (14) and the hammer candlestick pattern suggest a stable bullish rally in the future. |
| Graphic provided by: StockCharts.com. |
| |
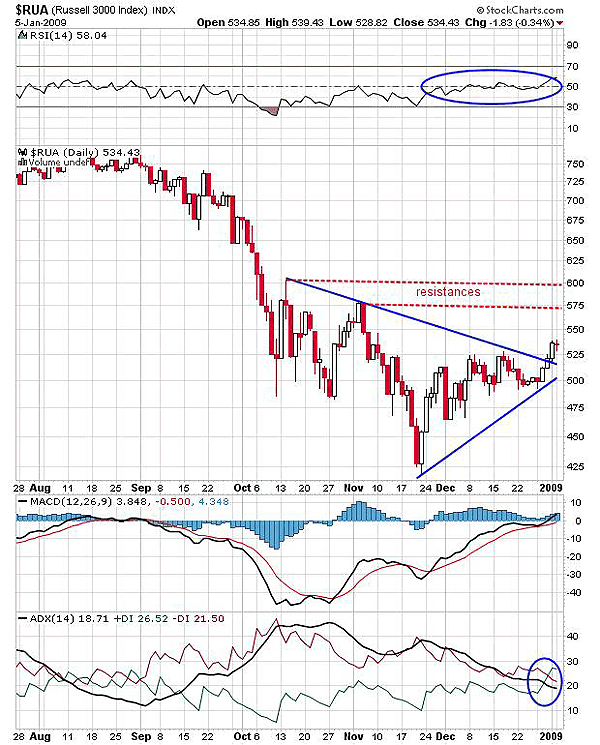
| Let us now refer to the short-term chart (daily chart) for a trading perspective. In Figure 2, a symmetrical triangle is formed by the lower highs and the higher lows. After hitting the low, $RUA rallied upward, forming higher lows. The triangle has matured, and the index has recently violated the pattern in a bullish direction. The breakout would lead the rally toward the resistance at 575 and 600. For the confirmed breakout, $RUA has to establish support on the upper declining trendline. The RSI (14) indicate consistent bullish strength as the indicator has formed a strong support above the 50 levels. In addition, the moving average convergence/divergence (MACD) (12,26,9) is ready to move in a positive territory above the zero line. |

|
| FIGURE 2: $RUA, DAILY. The index has a bullish breakout of the symmetrical triangle pattern. The ADX (14) suggest short-term uptrend above 20 levels. |
| Graphic provided by: StockCharts.com. |
| |
| The downtrend that existed for almost a year has weakened, so the bullish force is likely to increase. The ADX (14) above 20 with a strong buying pressure indicated by the positive directional index (+DI) would initiate a fresh uptrend for the index. Traders need not break their hearts with the doji formed on Tuesday. Few consolidated days would accumulate the bullish strength for the future rally. |
| The resistance at 575-600 is the nearest target for the breakout rally. Thus, traders can make a top list of the equities that are part of $RUA for good buying opportunities. |
Active trader in the Indian stock markets since 2003 and a full-time writer. Trading is largely based upon technical analysis.
| Company: | Independent |
| Address: | C1/3 Parth Indraprasth Towers. Vastrapur |
| Ahmedabad, Guj 380015 | |
| E-mail address: | chaitalimohile@yahoo.co.in |
Traders' Resource Links | |
| Independent has not added any product or service information to TRADERS' RESOURCE. | |
Click here for more information about our publications!
PRINT THIS ARTICLE

Request Information From Our Sponsors
- StockCharts.com, Inc.
- Candle Patterns
- Candlestick Charting Explained
- Intermarket Technical Analysis
- John Murphy on Chart Analysis
- John Murphy's Chart Pattern Recognition
- John Murphy's Market Message
- MurphyExplainsMarketAnalysis-Intermarket Analysis
- MurphyExplainsMarketAnalysis-Visual Analysis
- StockCharts.com
- Technical Analysis of the Financial Markets
- The Visual Investor
- VectorVest, Inc.
- Executive Premier Workshop
- One-Day Options Course
- OptionsPro
- Retirement Income Workshop
- Sure-Fire Trading Systems (VectorVest, Inc.)
- Trading as a Business Workshop
- VectorVest 7 EOD
- VectorVest 7 RealTime/IntraDay
- VectorVest AutoTester
- VectorVest Educational Services
- VectorVest OnLine
- VectorVest Options Analyzer
- VectorVest ProGraphics v6.0
- VectorVest ProTrader 7
- VectorVest RealTime Derby Tool
- VectorVest Simulator
- VectorVest Variator
- VectorVest Watchdog
