HOT TOPICS LIST
- MACD
- Fibonacci
- RSI
- Gann
- ADXR
- Stochastics
- Volume
- Triangles
- Futures
- Cycles
- Volatility
- ZIGZAG
- MESA
- Retracement
- Aroon
INDICATORS LIST
LIST OF TOPICS
PRINT THIS ARTICLE
by Donald W. Pendergast, Jr.
Despite the numerous economic uncertainties surrounding the US auto industry, Ford stock appears to be on track to go higher.
Position: Buy
Donald W. Pendergast, Jr.
Donald W. Pendergast is a financial markets consultant who offers specialized services to stock brokers and high net worth individuals who seek a better bottom line for their portfolios.
PRINT THIS ARTICLE
TECHNICAL ANALYSIS
Ford To Motor Higher?
01/07/09 10:01:05 AMby Donald W. Pendergast, Jr.
Despite the numerous economic uncertainties surrounding the US auto industry, Ford stock appears to be on track to go higher.
Position: Buy
| Since peaking at $38.83 in April 1999, it's been anything but happy motoring for shares of Ford Motor Co. (F). In fact, in the wake of the most recent bear market selloffs, shares plunged as low as $1.01, a 97% drop from the all-time high. Every trend ends sooner or later, and, for the moment, Ford stock is attempting to establish an uptrend as it seeks to escape the grasp of the hungry bear. |

|
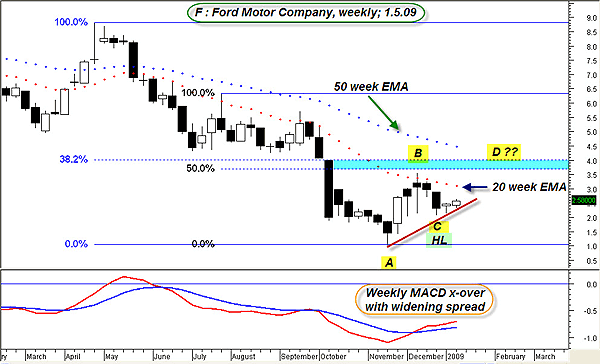
| FIGURE 1: F, WEEKLY. A widening MACD spread may be signaling higher prices ahead. |
| Graphic provided by: MetaStock. |
| |
| As the broad market (New York Composite index, NYA) has recovered, so have shares of Ford. After printing a significant weekly reversal candle (point A), prices pulled back after meeting the 20-week exponential moving average (EMA) (red dots near point B) then established a higher low (point C) shortly thereafter. Meanwhile, the moving average convergence/divergence (MACD) printed a bullish crossover, confirming the potential for a continuation of the trend reversal (Figure 1). Right now, this nascent uptrend is still intact, and the fact that the MACD spread (the difference between the MACD indicator and its signal line) is widening also bodes well for higher prices in the weeks to come. The next hurdles for F to overcome include the 20-week EMA, followed by a multi-Fibonacci resistance zone between $3.70–4.00. If we drill down to the daily chart (Figure 2), we can discover even more technical clues regarding the possible trajectory for Ford shares as January unfolds. |

|
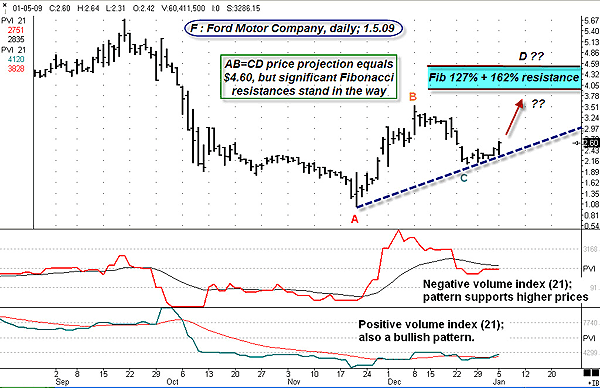
| FIGURE 2: F, DAILY. Bullish trends in the Negative and Positive volume indexes are also confirming the emerging uptrend. Significant overhead resistances stretch from $3.54 to $4.45. |
| Graphic provided by: Ensign Windows. |
| |
| Now an even more bullish picture emerges. First off, the negative and positive volume indexes (with a 21-period moving average) clearly shows that volume is supportive of the emerging uptrend. Prices are generally rising on days of increasing volume even as they are also generally increasing on days of negative volume. After establishing an up trendline (from points A to C), prices have launched higher; today's close near the highs on heavy volume is also a very bullish sign. So far, the evidence suggests that the probabilities favor higher prices; in fact, XLI (Industrial Select Sector SPDR ETF), a closely correlated ETF to Ford (0.93 yearly correlation), is also confirming the move in Ford. Of course, Ford faces several impediments to higher prices on the daily chart, just as it does on the weekly one. For starters, the previous high at point B ($3.54) is likely to offer the first major resistance. If F can clear that, the twin Fibonacci extension levels of the BC swing will come into play at $3.94 (127% Fib extension) and then at $4.45 (162% Fib extension). And if that isn't enough numerology, a simple AB=CD swing projection (swing AB = $2.53, so we simply add $2.53 to the low at point C, thus giving us $2.53 + $2.07 = $4.60) is calculating that Ford's CD swing may top out near $4.60. Will prices make it that high without a major correction? No one can say for sure, but at least such calculations can give traders a ballpark estimate of likely target zones. |
| Overall, the weight of the technical evidence appears to favor higher prices for Ford. How might traders choose to play this setup now? Shorter-term market participants might choose to time pullback entries on 30- or 60-minute charts as daily swing CD plays out. Daily-based traders might also wait for a minor pullback on a 60-minute chart in anticipation of a continuation move up toward the previously mentioned resistance zones. The reward to risk (RR) ratio is still very good on a daily entry; the uptrend line is the logical place to place a stop-loss at, say, $2.25; if we use point B as our initial target ($3.54), we are provided with a RR ratio of approximately 2.30 to 1. That's a good ratio, one that has a solid technical structure backing it up. There really isn't enough technical evidence to consider a weekly entry right now, but that may change in the weeks to come. So, for daily and 30- to 60-minute traders, I rate Ford as a solid buy. Weekly traders should continue to monitor the unfolding pattern, being sure to confirm that the broad market is also signaling the likelihood of higher prices. |
Donald W. Pendergast is a financial markets consultant who offers specialized services to stock brokers and high net worth individuals who seek a better bottom line for their portfolios.
| Title: | Writer, market consultant |
| Company: | Linear Trading Systems LLC |
| Jacksonville, FL 32217 | |
| Phone # for sales: | 904-239-9564 |
| E-mail address: | lineartradingsys@gmail.com |
Traders' Resource Links | |
| Linear Trading Systems LLC has not added any product or service information to TRADERS' RESOURCE. | |
Click here for more information about our publications!
Comments
Date: 01/08/09Rank: 2Comment:

Request Information From Our Sponsors
- StockCharts.com, Inc.
- Candle Patterns
- Candlestick Charting Explained
- Intermarket Technical Analysis
- John Murphy on Chart Analysis
- John Murphy's Chart Pattern Recognition
- John Murphy's Market Message
- MurphyExplainsMarketAnalysis-Intermarket Analysis
- MurphyExplainsMarketAnalysis-Visual Analysis
- StockCharts.com
- Technical Analysis of the Financial Markets
- The Visual Investor
- VectorVest, Inc.
- Executive Premier Workshop
- One-Day Options Course
- OptionsPro
- Retirement Income Workshop
- Sure-Fire Trading Systems (VectorVest, Inc.)
- Trading as a Business Workshop
- VectorVest 7 EOD
- VectorVest 7 RealTime/IntraDay
- VectorVest AutoTester
- VectorVest Educational Services
- VectorVest OnLine
- VectorVest Options Analyzer
- VectorVest ProGraphics v6.0
- VectorVest ProTrader 7
- VectorVest RealTime Derby Tool
- VectorVest Simulator
- VectorVest Variator
- VectorVest Watchdog
