HOT TOPICS LIST
- MACD
- Fibonacci
- RSI
- Gann
- ADXR
- Stochastics
- Volume
- Triangles
- Futures
- Cycles
- Volatility
- ZIGZAG
- MESA
- Retracement
- Aroon
INDICATORS LIST
LIST OF TOPICS
PRINT THIS ARTICLE
by Donald W. Pendergast, Jr.
Learn how a simple, yet effective price pattern can help you forecast likely turning points in the markets you follow.
Position: N/A
Donald W. Pendergast, Jr.
Donald W. Pendergast is a financial markets consultant who offers specialized services to stock brokers and high net worth individuals who seek a better bottom line for their portfolios.
PRINT THIS ARTICLE
RECURRENT PATTERNS
A Simple Pattern Forecasts A Reversal
01/06/09 08:49:57 AMby Donald W. Pendergast, Jr.
Learn how a simple, yet effective price pattern can help you forecast likely turning points in the markets you follow.
Position: N/A
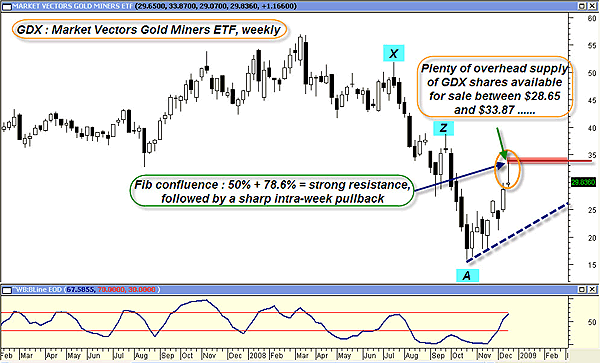
| The Market Vectors Gold Miners ETF (GDX), a wonderful exchange traded fund (ETF) proxy for the Amex Gold Bugs index (HUI), has rebounded with gusto since making a major low on October 24, 2008. Up as much as 114% (from the low) on December 17, 2008, the stock proceeded to drop sharply, causing some to question whether the bull market in gold mining shares was still a go. While no one knows if the golden bull will regain its footing, climbing to new heights (or not), it's clear that this selloff was not a surprise for savvy traders, traders using a combination of technical tools, measurements, and patterns. A glance at the weekly chart of GDX can help us put this recent setback into proper perspective. See Figure 1. |

|
| FIGURE 1: GDX, WEEKLY. When two significant Fibonacci ratios agree on a support/resistance level, expect price to react when that level is reached. |
| Graphic provided by: MetaStock. |
| Graphic provided by: WB BLine EOD from ProfitTrader for MetaStock. |
| |
| Even though GDX rallied nicely after making that major low in October, the fact is that the stock is still in a technical bear market rally, not even having retraced half of the losses since heavy selling began in March 2008. Wise technicians would have known ahead of time that GDX would face major overhead resistance if and when it began to recover and rise higher. They also know that when two Fibonacci retracement levels are in close proximity to one another, the resulting support/resistance barrier is much more formidable. Such is the case on the GDX weekly graph, as a 50% retracement from swing XA coincided with a 78.6% retracement from swing ZA — right at the peak of this week's price bar in GDX. Look at how far the candle reversed on an intraweek basis, suggesting that the Fibonacci confluence zone was being watched by knowledgeable market participants. However, if we drop down to a daily chart of GDX, we'll learn that there was a much more specific early warning that a significant reversal was likely to take place in this precious metals ETF. See Figure 2. |

|
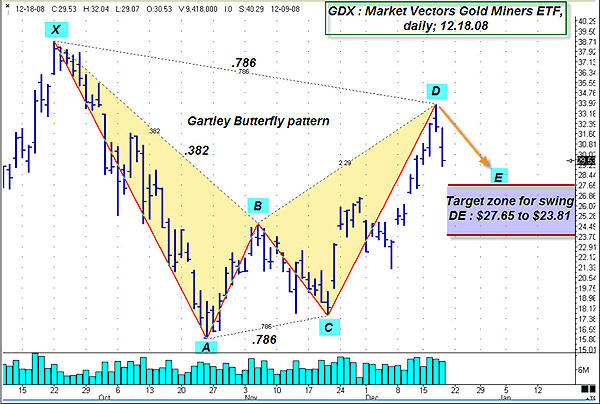
| FIGURE 2: GDX, DAILY. A reasonably well-formed Gartley 222 pattern. This example would have allowed a trader to project a likely reversal zone — at point D. |
| Graphic provided by: Ensign Windows. |
| |
| Well-educated traders, market pros with knowledge of reliable chart patterns that provide accurate forecasting ability, are typically one step ahead of the rest of the trading masses. One of the best patterns of all is the Gartley 222 pattern, sometimes referred to as a butterfly pattern. Originally discovered and categorized in 1935 (at about the same time that R.N. Elliott discovered the wave principle bearing his name) by HM Gartley, it has become much more widely known due to the efforts of a modern-day trader named Larry Pesavento. The process of evaluating an unfolding 222 pattern is fairly straightforward; once major swing XA was complete, a sharp trader would be looking to see if swing AB would retrace 38.2% to 61.8%% of swing XA. Then he would check to see if a BC swing, one retracing 38.2% to 78.6% of swing AB, would form. At this point, if the proportion of the swings look correct, the trader could further monitor for the eventual formation of a CD swing, one retracing 61.8% to 78.6% of swing XA. Ideally, swing AB will also equal swing CD, but in the real world, that doesn't always happen, and such is the case with the butterfly pattern depicted here. Nevertheless, the overall shape of the completed pattern has the right look about it, one that inspires confidence in its forecasting ability. Interestingly, swing XA only took 0.667 as much time to form as did swing AD. That's not too far from an ideal Fibonacci 61.8% ratio. The sharper down thrust of swing XA compared to the more gradual ascent of swing AD is also another visual confirmation that GDX is still in a bear market, one that still needs time to overcome a massive amount of overhead supply. The lavender box shows the typical target range for swing DE; the maximum logical target is the 61.8% retracement of swing AD, or about $23.81. The minimum target comes in at about $27.65. It's just a guideline, and traders need to realize that the DE swing can materialize and then complete in a variety of ways; it's usually best to place the Gartley pattern within the context of the higher time frame's trend when determining an exit strategy. In other words, don't hang around too long, hoping for a major move that may never materialize. We'll look at one final chart, a 60-minute GDX graph, one that demonstrates how shorter-term players were able to get a jump on a completed daily butterfly pattern. See Figure 3. |

|
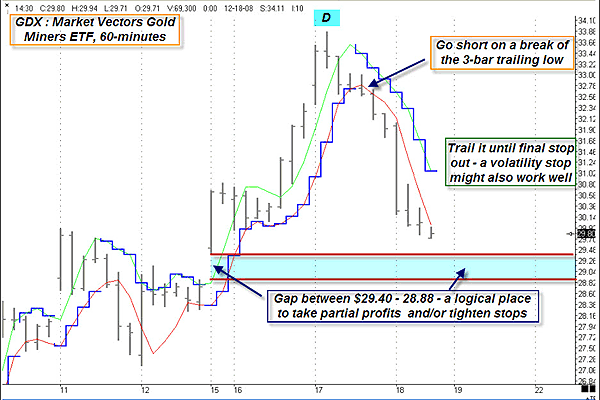
| FIGURE 3: GDX, HOURLY. Using a lower time frame chart may provide some timing advantages when attempting to capitalize on a Gartley pattern. |
| Graphic provided by: Ensign Windows. |
| |
| Nothing fancy here, just common trading sense. Waiting to enter until price demonstrates a breakdown is occurring is a wise strategy. In this case, a break of the three-bar trailing low is used as an entry trigger, and the same three-bar low is used as a trailing stop. Some traders like to wait for a retracement entry, which is also a valid method. The only drawback is that some signals will be missed if price breaks strongly after the butterfly pattern completes on the daily chart. In this GDX trade, a wise trader would be aware of the large gap between $29.40 and $28.88, a likely support/resistance battleground. Tightening stops and/or taking partial profits as prices approach such major gaps is always a prudent strategy. |
| Price patterns rarely come delivered in textbook-perfect proportions, but the Gartley butterfly pattern is still one of the most reliable chart patterns ever discovered. When placed in the proper context of higher time frame trend, support/resistance, and other fundamental supply/demand factors, it can and does deliver consistent profits for those who develop a sense of acceptable pattern form. |
Donald W. Pendergast is a financial markets consultant who offers specialized services to stock brokers and high net worth individuals who seek a better bottom line for their portfolios.
| Title: | Writer, market consultant |
| Company: | Linear Trading Systems LLC |
| Jacksonville, FL 32217 | |
| Phone # for sales: | 904-239-9564 |
| E-mail address: | lineartradingsys@gmail.com |
Traders' Resource Links | |
| Linear Trading Systems LLC has not added any product or service information to TRADERS' RESOURCE. | |
Click here for more information about our publications!
Comments
Date: 01/07/09Rank: 4Comment:

Request Information From Our Sponsors
- StockCharts.com, Inc.
- Candle Patterns
- Candlestick Charting Explained
- Intermarket Technical Analysis
- John Murphy on Chart Analysis
- John Murphy's Chart Pattern Recognition
- John Murphy's Market Message
- MurphyExplainsMarketAnalysis-Intermarket Analysis
- MurphyExplainsMarketAnalysis-Visual Analysis
- StockCharts.com
- Technical Analysis of the Financial Markets
- The Visual Investor
- VectorVest, Inc.
- Executive Premier Workshop
- One-Day Options Course
- OptionsPro
- Retirement Income Workshop
- Sure-Fire Trading Systems (VectorVest, Inc.)
- Trading as a Business Workshop
- VectorVest 7 EOD
- VectorVest 7 RealTime/IntraDay
- VectorVest AutoTester
- VectorVest Educational Services
- VectorVest OnLine
- VectorVest Options Analyzer
- VectorVest ProGraphics v6.0
- VectorVest ProTrader 7
- VectorVest RealTime Derby Tool
- VectorVest Simulator
- VectorVest Variator
- VectorVest Watchdog
